What's PLANERGY?

Modern Spend Management and Accounts Payable software.

Helping organizations spend smarter and more efficiently by automating purchasing and invoice processing.

We saved more than $1 million on our spend in the first year and just recently identified an opportunity to save about $10,000 every month on recurring expenses with PLANERGY.

King Ocean Logo

Cristian Maradiaga

King Ocean

Download a free copy of "Indirect Spend Guide", to learn:

  • Where the best opportunities for savings are in indirect spend.
  • How to gain visibility and control of your indirect spend.
  • How to report and analyze indirect spend to identify savings opportunities.
  • How strategic sourcing, cost management, and cost avoidance strategies can be applied to indirect spend.

Automated Spend Analysis: What Is It, Benefits, and Examples

Automated Spend Analysis

Spend analysis is a business process involving collecting, cleansing, classifying, and analyzing expenditure data.

The primary goal is decreasing procurement costs, improving efficiency, and monitoring compliance.

By examining spending patterns and identifying trends, businesses can make data-driven decisions that lead to significant cost savings.

Understanding Spend Analysis

Spend analysis is a four-stage process:

Spend analysis is a four stage process

  1. Data Collection

    The first stage of spend analysis involves gathering all spend data from different sources. This data could come from invoices, purchase orders, payment records, and other financial documents that record business transactions.

    The goal is a comprehensive and complete overview of the organization’s spending.

  2. Data Cleansing

    Once all the procurement spend data has been collected from the various data sources, the next step is data cleansing. This stage involves removing errors, duplicates, and irrelevant entries from the data.

    Ensuring the accuracy of the data at this stage is crucial, as any errors can significantly impact the results of the analysis.

  3. Data Classification

    After the data has been cleaned, it is classified or categorized based on factors such as product type, supplier, department, etc.
    This process helps to organize the data to make it easier to analyze and draw meaningful insights.

  4. Data Analysis

    The final stage of spend analysis is the actual analysis of the data. At this point, the classified data is evaluated to identify spending patterns, trends, and potential areas for cost reduction.

    This stage is where the real value of spend analysis comes in, as the insights gained can help businesses make strategic decisions about their spending.

    To perform a spend analysis, you would follow these stages, starting with collecting all relevant data, cleaning it to ensure its accuracy, classifying it meaningfully, and finally, analyzing it to draw valuable insights about your spending habits.

    An example of a spend analysis might involve a company analyzing its office supply expenses.

    The company could collect data on every office supply purchase made over the past year, categorize this data by supplier and product type, and then analyze it to see if any suppliers are charging more than others or if there are any opportunities to consolidate suppliers and negotiate bulk pricing.

Embracing Automation in Spend Analysis

Automated spend analysis uses software tools to automate the stages of spend analysis.

These tools can collect data from multiple sources, clean and classify the data automatically, and provide user-friendly dashboards and reports for easy analysis.

Automated spend analysis works by leveraging technology to streamline the traditionally manual and time-consuming spend analysis process.

This can significantly reduce the time it takes to generate insights, allowing businesses to act on cost-saving opportunities quickly.

Automated spend analysis is usually accomplished by integrating specialized software with a central Enterprise Resource Planning (ERP) system.

It’s frequently bundled with other solutions like cash flow prediction tools or supplier management systems – features that enhance each other’s effectiveness when used in conjunction.

When linked with an ERP system, automated spend analysis can take advantage of the live stream of data resulting from transactional exchanges with suppliers.

The process consists of the following steps:

Embracing automation in spend analysis

  1. Spend data is automatically gathered from purchase orders or invoices using optical character recognition (OCR) or a similar technique for maximum precision and minimal manual input.

  2. The spend analysis software interprets and compiles the data. Essential details such as the amount spent, the supplier, and the date of expenditure are normalized to create a uniform dataset. Spend categorization can also be performed at this stage if applicable.

  3. The spending data is then analyzed, producing straightforward, actionable insights. Typically presented through a central spend analysis dashboard, these insights are shared with stakeholders and can serve as a foundation for new spend management strategies or enhancements.

The specifics of the process may vary among different automated spend analysis platforms, but all rely on high-quality data.

Without appropriate inputs, the usefulness of spend analysis software is restricted.

As a result, it often coincides with broader digitization initiatives. Companies that digitize most of their spending can reap the most significant benefits.

Benefits of Automated Spend Analysis

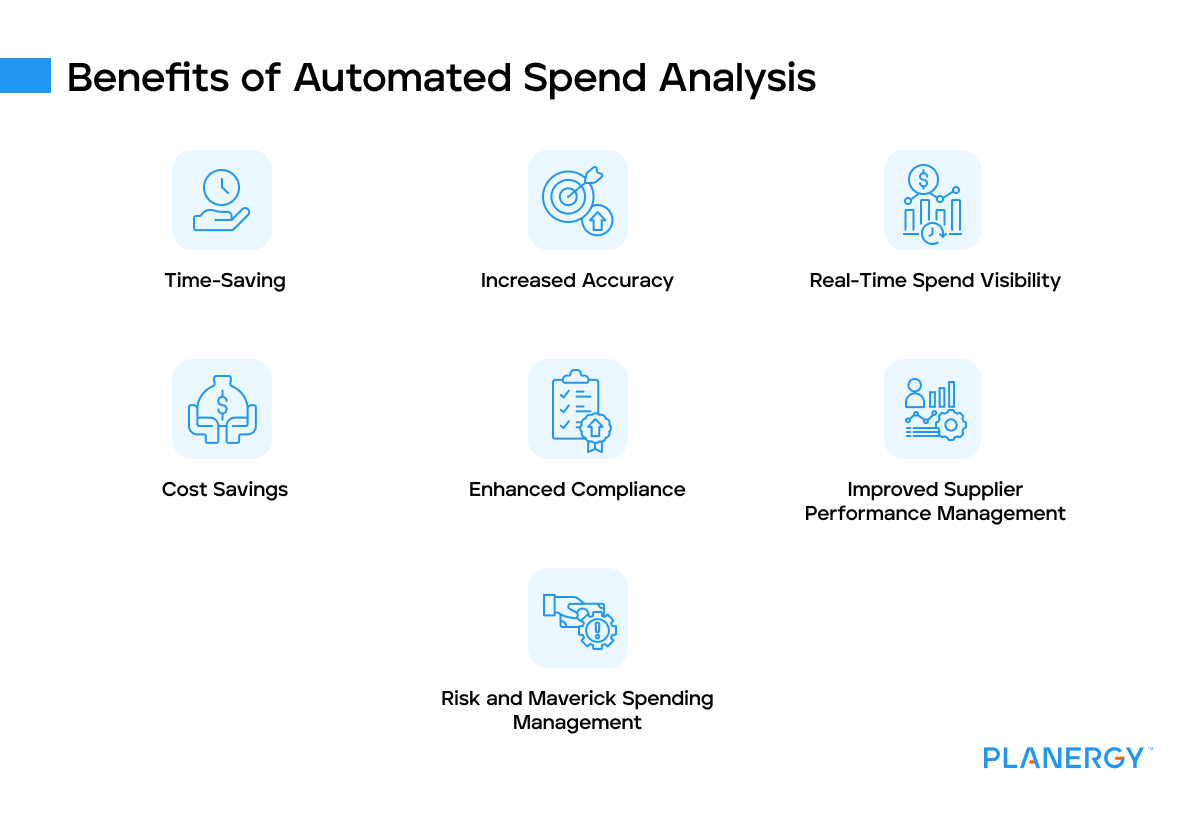
Automated spend analysis offers numerous advantages for businesses. It not only streamlines the process but also provides deeper insights into spending patterns and potential areas of savings.

Here are some key benefits:

Benefits of automated spend analysis

  • Time-Saving

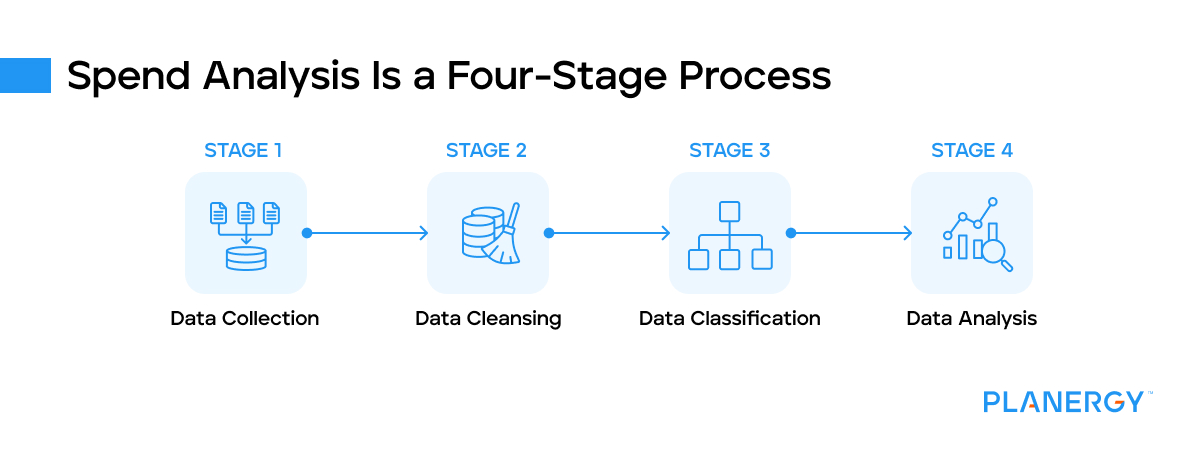
    One of the most significant benefits of automated spend analysis is the time it saves. Traditionally, spend analysis involves manually collecting, cleansing, classifying, and analyzing data, which can be a time-consuming and labor-intensive process.

    For example, consider a multinational corporation with operations in multiple countries.

    Collecting and consolidating spend data from various sources across different regions could take weeks or even months if done manually.

    On the other hand, an automated system can gather and process this data in a fraction of the time, freeing up valuable resources that can be used for other strategic tasks.

  • Increased Accuracy

    Automated spend analysis reduces the risk of human error that can occur during aggregate data collection, cleansing, and classification.

    By automating these processes, businesses can ensure the accuracy and reliability of their data.

    For instance, suppose a company is looking at its IT expenditure. Manual data entry could potentially lead to errors such as duplicate entries or misclassified expenses.

    However, an automated system can identify and correct such errors, ensuring the data’s accuracy and reliability.

  • Real-Time Spend Visibility

    Automated spend analysis provides real-time visibility into spending patterns, enabling businesses to make more informed decisions.

    With traditional manual methods, there’s often a lag between data collection and analysis, which can delay decision-making.

    Consider a business that notices a sudden spike in its utility costs. The company can quickly identify and address the issue with real-time tracking and alerts from an automated system, preventing further unnecessary expenditure.

  • Cost Savings

    Automated spend analysis can help businesses significantly reduce their expenses by identifying inefficiencies and opportunities for cost reduction.

    The system can highlight areas where a business may be overspending or where there may be potential for negotiating better terms with suppliers.

    For example, an automated system could identify a company purchasing the same product from multiple suppliers at varying prices.

    With this insight, the company could negotiate a bulk purchase deal with a single supplier, resulting in substantial savings opportunities.

  • Enhanced Compliance

    Automated spend analysis can also help businesses monitor and enhance their compliance with internal policies and external regulations.

    The system can flag non-compliant purchases or contracts that don’t align with the company’s procurement policies, enabling timely corrective action.

    For instance, a company might have a policy against doing business with suppliers with poor environmental records.

    An automated spend analysis tool can flag any transactions with such suppliers, allowing the company to enforce its policy and uphold its commitment to sustainability.

  • Improved Supplier Performance Management

    Organizations can gain insight into supplier performance to encourage stronger supplier relationships and proactive development.

    With automated spend analysis, companies can easily generate a list of non-performing suppliers. Using this information, they can improve contract compliance with continuous price monitoring.

    Supplier scorecards assist in evaluating suppliers and vendors because they capture performance metrics.

    Comprehensive spend analysis provides additional information about how much money your organization spends with each supplier on various goods and services, and which suppliers get the most of your business.

    Having this spend data readily available and easily accessible is particularly helpful in contract negotiations because it allows organizations to maximize their procurement budget.

    Companies can collaborate with fewer suppliers for more strategic sourcing when implemented well.

    This translates to greater value, establishing a leaner and more efficient procurement process.

    Spend analytics benefits the entire supply chain. When it’s time to negotiate a contract, both parties can focus on their respective strategic goals without getting caught up in the fight for small wins.

  • Risk and Maverick Spending Management

    Maverick spending comes into play when employees opt to go outside of the approved suppliers to purchase goods and services. When this happens, it affects profits and contract compliance and fulfillment.

    Identifying maverick spend is essential; the only way to do this is to increase spend visibility.

    Organizations must be able to identify any and all unmanaged costs, which requires a detailed spend analysis, including tail spend analysis.

    Accountability helps in tracking mistakes to a particular person or source, to address the issue at the root cause.

    Procurement organizations often use spend analysis as the first step in aligning the sourcing and competitive strategies.

    When done properly, organizations can identify opportunities to leverage buying power to reduce costs, improve operational performance and supplier management, and also improve relationships with all stakeholders, both internal and external.

    Most of today’s spend analysis technology allows for ERP cloud-native setups with real-time spend reporting to make for a simple spend analysis process.

    The analytics tools make for easier data management and improved spend management.

Challenges of Automated Spend Analysis

While automated spend analysis can offer numerous benefits, it has challenges. Here are some of the common obstacles procurement teams might face:

Challenges of automated spend analysis

  • Lack of Awareness About Spending Data Sources

    One of the primary issues procurement teams may encounter is a lack of awareness about the various spending data sources.

    This can make it difficult to collect all the necessary information for comprehensive analysis, potentially leading to missed potential savings opportunities.

  • Bad Spend Classification

    If spending isn’t correctly classified with proper category management, it can hinder the accuracy of the analysis and the effectiveness of the procurement strategy.

    For example, if expenditures are miscategorized, it could skew the results and lead to incorrect conclusions about where money is being spent.

  • Data Quality Issues

    The quality of the data used in automated spend analysis is crucial. If the data is incomplete, outdated, or inaccurate, it can compromise the insights’ reliability.

    This can make it challenging to measure KPIs effectively and accurately gauge the success of procurement initiatives.

  • Lack of Standardization

    Without standardization, comparing spending data across different departments, locations, or suppliers can be difficult. Identifying trends or discrepancies can make it challenging, which is key to uncovering potential savings opportunities.

  • Tool Integration Problems

    Integrating the automated spend analysis tool with other systems, like ERP or CRM software, can sometimes pose challenges.

    If the systems don’t communicate well with each other, it can lead to data silos and hinder the flow of information, making the analysis less effective.

  • Reliance on Outdated Data

    If the spend analysis solution relies on outdated data, it can provide an inaccurate picture of current business spend.

    This can make it difficult for procurement teams to make informed decisions and adjust their strategy as needed.

Tools for Automated Spend Analysis

Many tools are available for automated spend analysis, from standalone software solutions to features built into larger procure-to-pay systems.

These tools can integrate with existing financial systems, apply advanced analytics algorithms to the data, and present the results in an easy-to-understand format.

Having spend analysis built into procure-to-pay software helps avoid data problems like inconsistencies and silos, as all relevant data is stored in one place.

This unified system improves visibility into spending patterns and makes it easier to identify potential cost-saving opportunities.

Cost Analysis vs. Spend Analysis

While both cost analysis and spend analysis aim to identify cost-saving opportunities, they focus on different areas. Cost analysis concerns the costs associated with producing a product or service, aiming to identify ways to reduce these production costs.

On the other hand, spend analysis focuses on company-wide spending, including indirect spending like office supplies and utilities, with the goal of reducing overall expenditure across all business units.

Automated spend analysis is a powerful tool for businesses looking to improve their bottom line.

By leveraging procurement software to streamline the spend analysis process, businesses can gain deeper insights into their spending habits and make data-driven decisions that boost profitability and growth.

What’s your goal today?

1. Use PLANERGY to manage purchasing and accounts payable

We’ve helped save billions of dollars for our clients through better spend management, process automation in purchasing and finance, and reducing financial risks. To discover how we can help grow your business:

2. Download our “Indirect Spend Guide”

Download a free copy of our guide to better manage and make savings on your indirect spend. You’ll also be subscribed to our email newsletter and notified about new articles or if have something interesting to share.

3. Learn best practices for purchasing, finance, and more

Browse hundreds of articles, containing an amazing number of useful tools, techniques, and best practices. Many readers tell us they would have paid consultants for the advice in these articles.

Business is Our Business

Stay up-to-date with news sent straight to your inbox

PLANERGY LOGO

Sign up with your email to receive updates from our blog