The information age is in full swing, and for most businesses around the globe, the data stream has overrun its banks and become a flood of big data.
From social media accounts to supply chain and spend data, businesses have unprecedented access to almost limitless information.
But with information, as with most things, value doesn’t always increase with volume. Data collection is just the first step.
Data management, coupled with big data analytics, will help you extract useful and relevant data from the vast piles of information on hand—and put it to use, building value and productivity for your business.
What is Big Data?
Big data refers to extremely large datasets that are difficult to analyze using traditional data processing methods.
These datasets typically include structured, semi-structured, and unstructured data from various sources such as text, images, audio, and video.
Big data is characterized by its three Vs: Volume (large amounts of data), Velocity (high speed of data generation and processing), and Variety (multiple types of data).
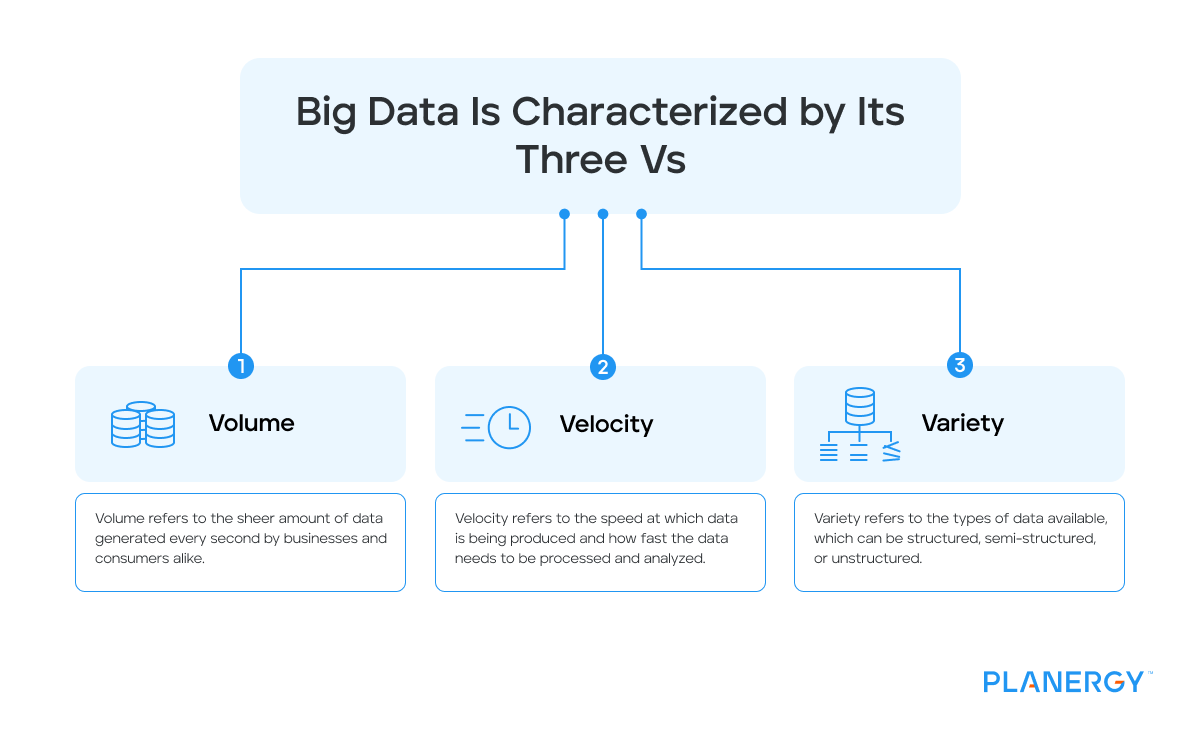
Volume
Volume refers to the sheer amount of data generated every second by businesses and consumers alike. This can range from terabytes to petabytes and beyond.
For example, every minute, users send 241 million emails, send 41.6 million WhatsApp messages, spend $455K on Amazon, make 6.3 million Google searches, and like 4 million Facebook posts. All of these activities generate massive volumes of data.
Velocity
Velocity refers to the speed at which data is being produced and how fast the data needs to be processed and analyzed.
With the advent of real-time processing technology, many businesses now need to analyze data as it is generated to gain immediate insights and respond quickly to changing circumstances.
For instance, credit card companies need to analyze transaction data in real-time to detect fraudulent activity and block the card if necessary.
Variety
Variety refers to the types of data available, which can be structured, semi-structured, or unstructured.
Structured Data
Structured data is organized in a predefined manner or according to a specific schema.
It’s typically stored in relational databases (RDBMS), where the data is arranged in tables with rows and columns.
Each column in a table corresponds to a certain attribute, and each row represents a record.
Examples of structured data include:
- Customer information like names, addresses, and phone numbers
- Transactional data such as purchase history, order ID, date, and time
- Sensor data like temperature readings, pressure readings, etc.
Structured data is easy to search, organize, and analyze using standard database management tools and SQL (Structured Query Language).
Semi-Structured Data
Semi-structured data does not conform to the formal structure of data models associated with relational databases or other forms of data tables but nonetheless contains tags or other markers to separate semantic elements and enforce hierarchies of records and fields within the data.
Examples of semi-structured data include:
- XML and JSON files
- Email messages where the data can be parsed but doesn’t fit into traditional tables
- Log files that contain data entries separated by certain delimiters
Semi-structured data is more flexible than structured data but requires more effort to analyze and process.
Unstructured Data
Unstructured data refers to data with no predefined format or organization, making it difficult to collect, process, and analyze.
Unstructured data can be textual or non-textual.Examples of unstructured data include:
- Text files like Word documents, PDFs, emails, and social media posts
- Audio and video files
- Images and photos
Unstructured data makes up the majority of data available, but its lack of structure makes it challenging to analyze using conventional tools and techniques.
Specialized tools and techniques like natural language processing (NLP) for text, image recognition for images, and deep learning algorithms for various types of unstructured data are often required.
The Importance of Big Data in Business
Big data plays a crucial role in modern business. It allows businesses to gain deeper insights into their operations, customer behavior, market trends, and competitors.
This information can help businesses optimize their strategies, make better decisions, improve customer service, and increase profitability.
Because of this, spending time crafting a quality data strategy focused on data security can give your company an edge.
Pros and Cons of Big Data
Like any other tool, big data comes with both advantages and drawbacks.
Pros
Informed Decision-Making
Big data can provide businesses with valuable insights for data-driven decisions.
For example, a retail business can use big data to analyze sales trends, customer buying habits, and market conditions.
This information can guide decisions about what products to stock, when to run sales, and how to price items.
Improved Customer Service
By analyzing customer data, businesses can understand their needs better and tailor their services accordingly.
For instance, Netflix uses big data to analyze their users’ viewing habits and preferences, allowing them to recommend shows and movies that users are likely to enjoy.
Increased Efficiency
Big data can help identify inefficiencies in business processes and suggest ways to improve them.
For example, a logistics company might use big data to analyze delivery routes and times, identifying bottlenecks or inefficiencies that can be addressed to speed up deliveries and reduce costs.
Cons

Data Privacy Concerns
Collecting and storing large amounts of data can raise privacy issues, especially if personal data is involved.
For example, Facebook faced backlash over the Cambridge Analytica data breach where users’ personal data was harvested without explicit consent for political advertising.
Data Management Challenges
Storing, processing, and analyzing big data requires advanced tools and skills.
Small businesses, in particular, might struggle with the cost and complexity of big data management.
For instance, a small e-commerce startup may struggle to manage the vast amounts of customer data they collect due to a lack of resources or technical expertise.
Risk of Misinterpretation
Big data can lead to incorrect conclusions and bad business decisions without proper analysis.
For example, correlational patterns may be mistaken for causal relationships, leading to incorrect conclusions and decisions.
A company might notice that their sales increase during periods when they publish more social media posts.
However, this doesn’t necessarily mean that the increased social network activity is causing the rise in sales; other factors could be at play.
Proper data visualization tools can help prevent misinterpretation.
Ethical Implications of Big Data
The ethical implications of big data revolve around privacy, consent, and transparency.
Businesses must ensure they collect, store, and use data ethically, respecting individuals’ privacy rights and obtaining consent when necessary.
They must also be transparent about their data practices to maintain trust with customers and stakeholders.
Is the Use of Big Data Good or Bad? The Answer Lies in How You Use It
Since the birth of big data analysis—long before the rise of machine learning, artificial intelligence, or even desktop computers—data scientists and the businesses that rely on them have been mining the information they collect for insights, process improvements, and competitive advantage.
In the 1950s, data analysis was coming into its own, and although it relied on small, local sources and slow, manual analysis of varying depths, Analytics 1.0 (as it’s now called) created the foundation for today’s more advanced methodologies.
Today, the Internet not only connects companies directly to consumers via email and social media but provides real-world, real-time information from smart devices on The Internet of Things, geotags, and their own data collection devices through accounting, enterprise resource planning (ERP), and customer resource management (CRM) software.
Gathering all this data is one thing; sifting through it to separate bad data from good and create data sets that produce useful business intelligence—the information derived from data analytics to improve decision-making and strategic planning— is another.
Good Data Vs. Bad Data
The question isn’t necessarily “Is big data good or bad?” but rather “How effectively and efficiently can large data sets be organized, stored, and analyzed to produce actionable intelligence?”
That said, what goes into your data analysis certainly has a powerful impact on what comes out.
Data quality is affected by a range of factors, including: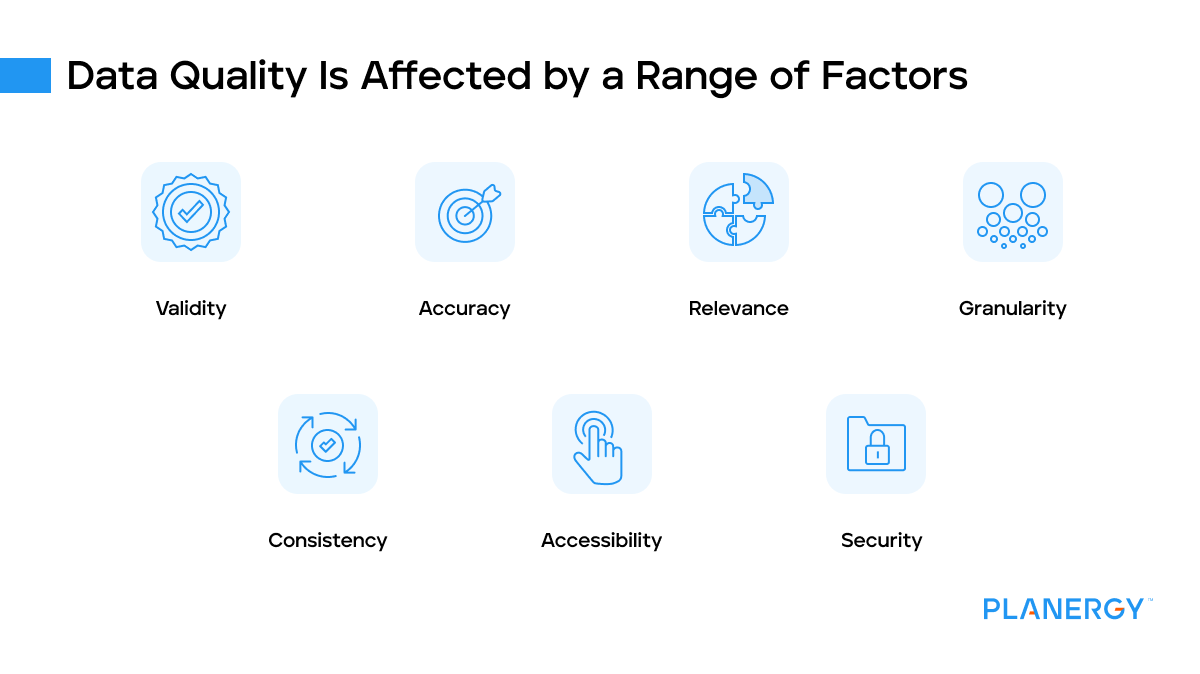
Validity: Is the data within the parameters you’re measuring?
Accuracy: Is the data correct and precise?
Relevance: Is the data relevant to the areas you’re investigating? Was the data collected in a timeframe useful to the results of your analysis?
Granularity: How detailed and fully granulated is the data collected? Is the information provided unique enough at the micro level to produce a more accurate picture in the macro?
Consistency: How was the data collected? Is it consistent with all other data sources? Has the data been compared and confirmed if multiple collection systems were used?
Accessibility: Internally or externally sourced, is the data available for review and analysis when needed? Can all stakeholders access the data to perform their duties from a variety of platforms, both mobile and desktop?
Security: Is the data stored securely, and protected against intrusion, tampering, and destruction? Is the data backed up remotely? If third-party data is used, have privacy concerns been addressed to ensure total security for (for example) customers’ personal information?
For many companies, maximum efficiency and efficacy begin with integrating a cloud-based procurement solution equipped with artificial intelligence-powered data analytics.
Using artificial intelligence, a centralized data management and storage server accessible from mobile apps and desktop clients, and customizable, intuitive automation, the right procurement software can make it easier to see, manage, and analyze all of the information generated by your spend, and use it to inform decision making across your organization.
Essential Big Data Tools
Your optimal software solution for managing your data projects and general big data use may not be the same as someone else’s.
But a set of core big data technologies drives data management, including:
Data Management Systems
To tame the never-ending flow of big data rushing into your system, you need processes and policies in place that ensure high-quality, accurate, and safe data acquisition and storage.
Coupling clear and thoroughly established automated processes with centralized data management with cloud-based storage and access means your whole organization has a more effective, reliable, and immediate way to put your data to use.
Machine Learning
When artificial intelligence is applied in order to teach a machine not just how to collect information but how to analyze and use it, machine learning is in play.
Machine learning blasts potential data analysis productivity into the stratosphere, using large data sets to rapidly pinpoint risks and opportunities for innovation and process improvement.
Hadoop
It may have an amusing name, but this open-source software framework is the backbone of big data management.
It enables clusters of applications to run in tandem across shared hardware, accessing shared databases stored on interconnected hardware.
It facilitates fast, scalable data collection, storage, management, and analysis.
Plus, it’s free and open-source, so anyone can benefit from its use.
Data and Text Mining
Artificial intelligence excels at pattern recognition, and looking for relevant patterns in the data flowing in and out of your business is an essential part of any AI worth its salt.
Data mining helps you catch the valuable golden nuggets in your digital sieve and use them for instant analysis, planning, and decision-making.
Text mining, a more specific subset of data mining, brings content from your website, social media, emails, articles, surveys, and other text sources into the analytical mix.
Predictive Analytics
Using a variety of advanced algorithms, predictive analysis devours historical data to create predictions about future outcomes.
In addition to providing valuable context and insight for marketing, financial, and procurement planning, it also helps slash risk exposure through faulty processes, human error, and fraud.
Benefits of Software-Driven Big Data Analytics
Compared to older iterations of analytics, modern “Analytics 3.0” solutions greatly increase the speed, precision, and accessibility of data from a wide variety of sources.
A process that could have taken months of careful data collection, review, and analysis using spreadsheets and physical documents can now produce valuable and actionable insights, accessible to everyone in the system, in minutes.
Consider these benefits of effectively integrated data analysis:
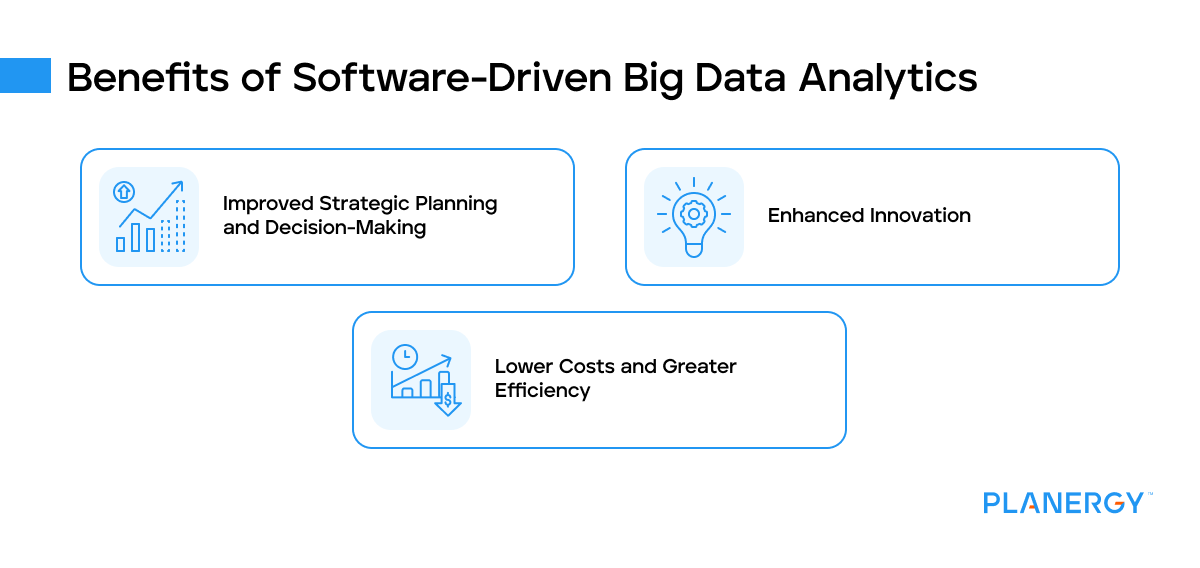
Improved Strategic Planning and Decision-Making: Both physical technology, like faster analytics using in-memory (i.e., RAM-based) analysis, and improved artificial intelligence (including machine learning) provide real-time access to information for faster, more accurate decisions and more strategic planning for not just spend, but marketing, production, and other initiatives.
Enhanced innovation: Connecting procurement data with sales and marketing data creates rich opportunities to meet customer expectations in exciting ways, both through developing new products and services and improving delivery, quality, and variety for existing ones.
Lower Costs and Greater Efficiency: With your data in one easy-to-access, secure location and paper a thing of the past, you can slash your materials and storage costs.
In addition, the analytics themselves can be used to examine your own internal business processes for improvement opportunities, including streamlined workflows and automating basic tasks to free your staff for higher-value ones.
Best Practices for Gaining Actionable Insights from Big Data in Business
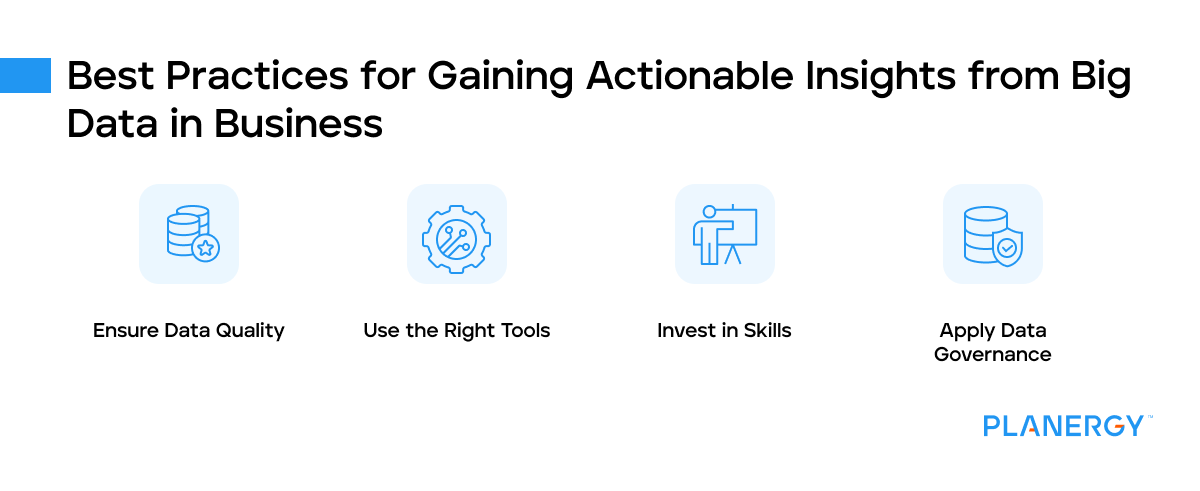
Ensure Data Quality
Data quality is fundamental to any big data project. Inaccurate, incomplete, or outdated data can lead to wrong conclusions and poor decisions.
Therefore, ensure your data is accurate, complete, timely, relevant, and understandable.
This might involve cleansing your data regularly, validating it for accuracy, and updating it as necessary.
A robust data management system can help maintain data quality and integrity.
Use the Right Tools
Big data requires advanced tools for storage, processing, and analysis. Traditional spreadsheet tools won’t suffice for big data.
You need powerful data analytics tools, such as Hadoop, Spark, and Tableau, that can handle large volumes of data.
These tools can help you collect, organize, analyze, and visualize your data, making it easier to gain actionable insights.
Invest in Skills
Big data analysis requires special skills. You need people who can understand data, interpret it, and translate it into actionable insights, such as data engineers.
This might require training your existing staff or hiring new people with expertise in data analysis, statistics, machine learning, and related areas.
Investing in skills will ensure you have the human capacity to harness the power of big data.
Apply Data Governance
Data governance involves implementing policies and procedures to manage and protect your data.
This includes defining who can access the data, how it should be used, and how it should be protected. Data governance also involves ensuring compliance with laws and regulations related to data privacy and protection.
A strong data governance framework can help ensure that your big data efforts are ethical, legal, and effective.
Turn Information into Insights
Everywhere you turn, information is flowing through your business. And like an old-time prospector, dropping your sieve into the torrent can yield valuable results—if you know where, when, and how to look.
Gathering those golden opportunities from the stream and turning big data into good data is easier with data analytics on your side.
Tap into the power of data science and technology and reap the benefits of faster, more useful insights that drive innovation, customer satisfaction, and a bigger bottom line for your business.
")


