
In the complex world of business finance, clarity and understanding of where money flows are crucial.
This is where Spend Cube Analysis (SCA) comes into play. It is a powerful tool that can unravel the intricacies of spending patterns to unlock significant strategic financial insights.
Learn how to leverage SCA to optimize spend management and improve profitability.
What is Spend Cube Analysis?
SCA is a multidimensional approach used in financial analysis and business decision-making.
It helps organizations understand and categorize their spending across various dimensions, enabling a holistic view of expenditures.
It provides the actionable insights to make informed, strategic decisions that can lead to substantial cost savings and efficiency improvements.
The Basics
It might sound like an extremely unlikely game show for maths fiends, but the “multidimensional cube” in “Spend Cube Analysis” is actually a data analysis tool generated by spend analytics tools or analysis software.
The Spend Cube is built around four critical dimensions: Who, What, When, and Where.
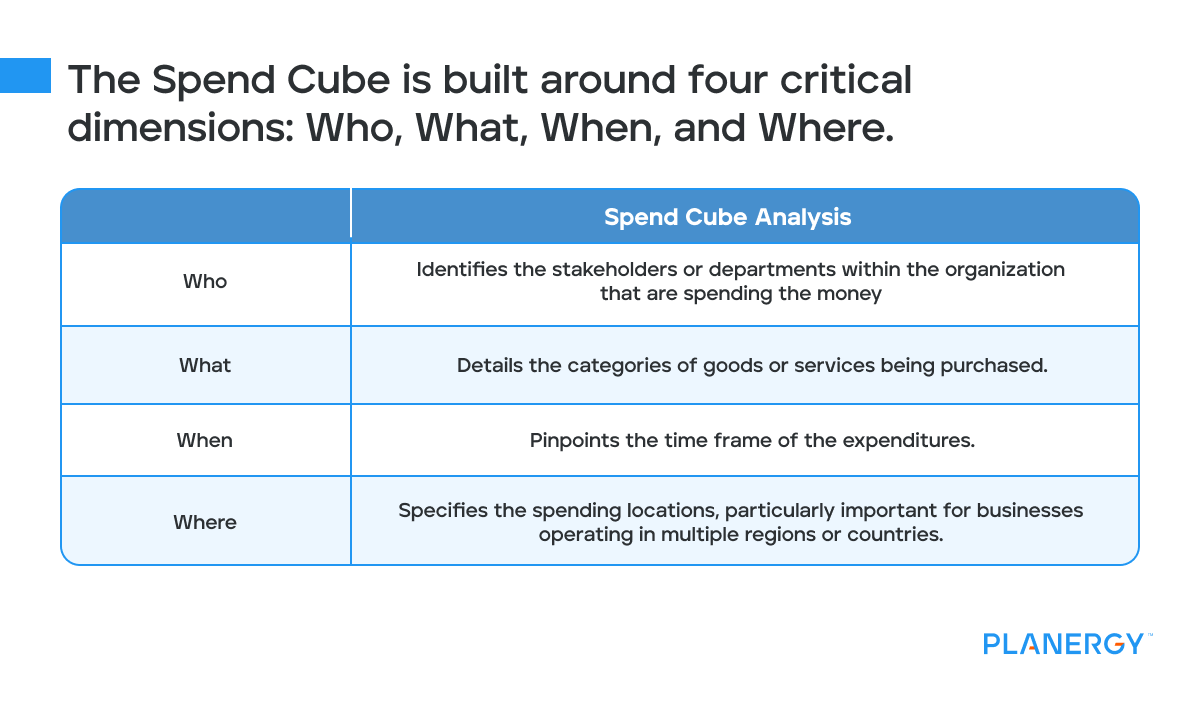
- Who: Identifies the stakeholders or departments within the organization that are spending the money.
- What: Details the categories of goods or services being purchased.
- When: Pinpoints the time frame of the expenditures.
- Where: Specifies the spending locations, particularly important for businesses operating in multiple regions or countries.
The spend cube is a graphic representation of spend analysis output, bringing together three dimensions of spend data: suppliers, corporate business units, and item categories.
The three different categories are each assigned an axis of the cube:
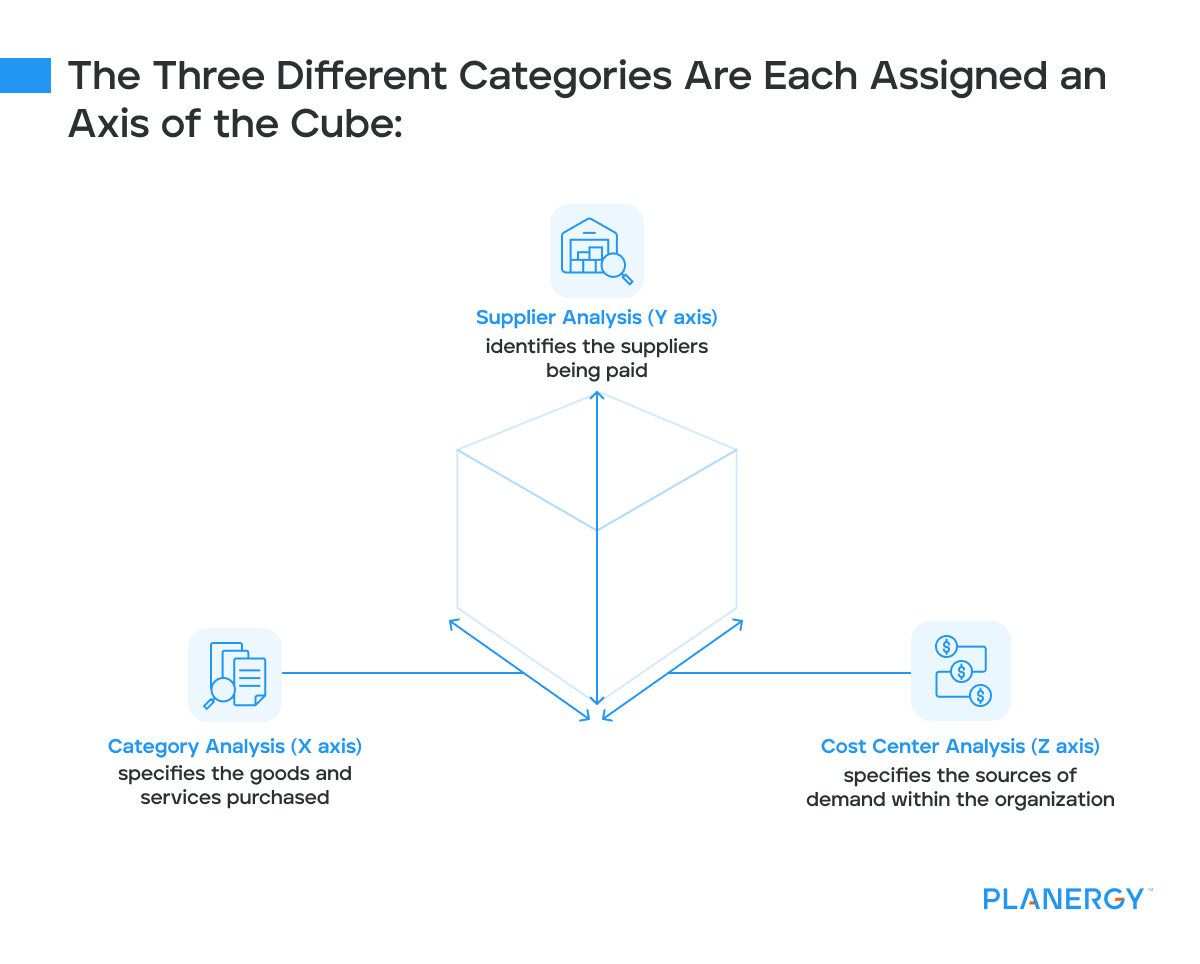
- Category Analysis (X axis) specifies the goods and services purchased.
- Cost Center Analysis (Z axis) specifies the sources of demand within the organization.
- Supplier Analysis (Y axis) identifies the suppliers being paid.
The process involves collecting and reviewing spend data to achieve insights that drive performance and profitability improvements in your procurement strategy.
These can include:
- Greater spend visibility, process improvements, improved contract compliance, etc., can lead to greater savings opportunities (both short and long-term).
- Greater efficiency within the procurement function and the organization it supports.
- Stronger and more strategic supplier relationships.
- Improve buying power and implement more strategic sourcing.
- Identifying and managing risk exposure.
By creating a baseline for spend data, spend analysis supports more strategic procurement and financial planning to support company goals.
It also helps reduce total cost of ownership (TCO) and maximize return on investment (ROI) to shift procurement away from mere cost reduction and toward value creation.
Step-by-Step Guide to Implementing SCA
Procurement organizations perform spend analysis by identifying, collecting, cleansing, enriching, classifying, and analyzing spend data sets.
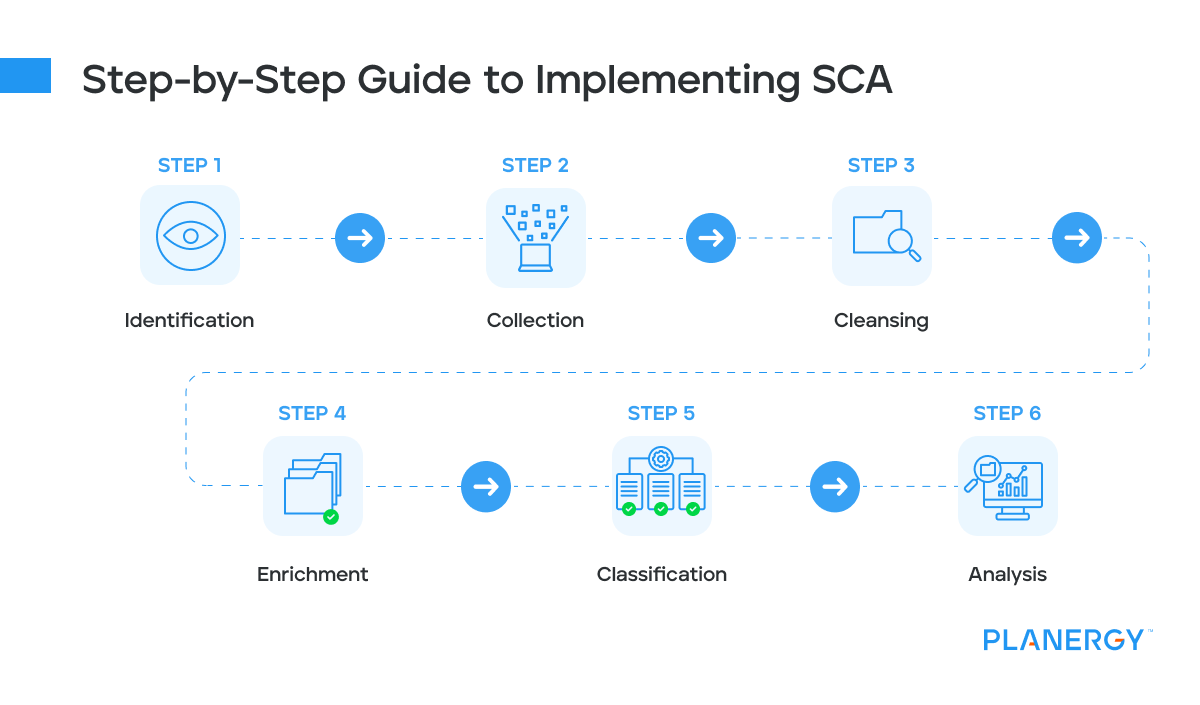
Identification is the measurement of total spend and the selection of target groups within it to narrow the scope of the analysis to specific product categories (and sub-categories), suppliers, departments, corporate business units, etc.
Collection (also called data extraction) is the actual capture of spend data and its consolidation from one or more formats.
Multiple data formats can come into play because businesses often rely on a range of programs, including Enterprise Resource Planning systems (ERP systems), accounting solutions, and office programs like Microsoft Excel to track and manage their data.
Dedicated procurement software can make corralling information from disparate data sources much easier.
Cleansing is the stage where data is reviewed for discrepancies, file corruption, and redundancies.
Transaction data is carefully examined for accuracy, and errors are removed.
Redundant stakeholders and suppliers can be excised, and records can be updated to reflect current information.
Enrichment involves refining the cleansed and corrected raw data using standardization.
All files are updated to use the same formatting and naming conventions and product and category codes are added or corrected as needed.
Classification is the further refinement of spend data by supplier.
Simultaneously, the data is sorted into specific groups based on (for example) sources of demand.
In addition to grouping all products purchased from a copier manufacturer (copy machines, toner, paper, etc.) into a supplier-based category, each product can also be broken out by demand and usage in different departments and business units.
This preserves the groupings while ensuring all transaction and spend data is connected and can be examined, analyzed, and manipulated within a single taxonomy, or system of classification.
Analysis takes the carefully collected, cleaned, and categorized data and uses data analytics to provide concrete answers and verify (for example):
- Buyers are following internal controls and only buying from preferred suppliers
- Contract terms and conditions are optimal for every product in the supply chain
- Actual spending patterns are in line with those forecast
- Which items are within target TCO parameters, and which need improvement
Equipped with complete and consolidated data, the procurement team can now generate a spend cube.
Types of Spend Cubes
Several types of spend cubes can be generated with a focus on different dimensions of spend.
They’re created using different types of spend analysis, including (but not limited to):
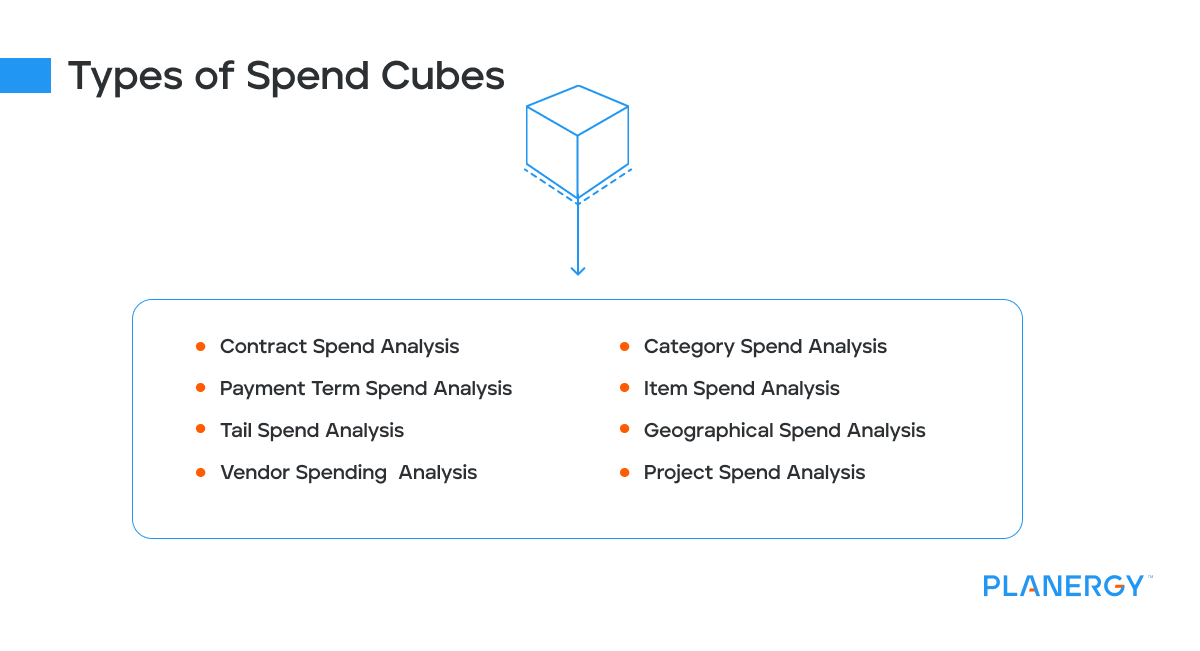
Contract Spend Analysis
This tool verifies contract compliance and improves contract management by optimizing terms, conditions, and pricing from preferred vendors.
Payment Term Spend Analysis
It is used to streamline the procure-to-pay (P2P) process and eliminate waste, fraud, and maverick spend by examining payment patterns, purchase order cycle times, approval bottlenecks, etc.
It also provides insight into cash flow improvements and greater savings from early payment discounts.
Tail Spend Analysis
Tail spend analysis is used to “trim the fat” and eliminate rogue/maverick spending by providing total visibility for all purchasing (and, therefore, all transaction data) in indirect spending.
It also improves internal compliance while helping to optimize the supply chain through vendor consolidation.
Vendor Spend Analysis
Vendor spend analysis is used to specify the percentage of spend dedicated to essential suppliers.
It supports supplier management and strategic sourcing by measuring supplier performance and compliance.
It also helps reduce the number of suppliers and create strategic contingencies for essential production materials.
Category Spend Analysis
It examines the dimensions of spend by category.
It supports improving category management, supply chain management, internal spend controls, and contract management through negotiation informed by more precise forecasting and risk management.
Item Spend Analysis
This tool parses expenditures to the line-item level. It reveals redundancies and discrepancies (e.g., are Plant A and Plant B both buying Widgets, but from different suppliers at two very different price points?). It also exposes maverick spend and sub-optimal vendor selection.
Geographical Spend Analysis
Organizes spend data based on geographical locations, such as by country, region, or office location.
This analysis can uncover localization opportunities, regional compliance requirements, or potential for consolidating suppliers in specific regions.
Project Spend Analysis
Focuses on analyzing expenditures associated with specific projects.
It offers visibility into project-based spending against budgets, helping to ensure projects stay on track financially.
Benefits of SCA
The adoption of Spend Cube Analysis can yield numerous benefits, including:
Enhanced Decision Making
One of the paramount benefits of Spend Cube Analysis is its ability to augment decision-making capabilities within an organization significantly.
By providing detailed insights into spending patterns, SCA equips decision-makers with the data they need to make informed, strategic choices.
This level of insight can be pivotal in identifying areas where financial resources could be better allocated, ensuring that every dollar spent drives value for the business.
Increased Transparency
With a comprehensive view of spending across all departments and categories, organizations can eliminate the guesswork and shadows often associated with financial management.
This transparency bolsters accountability and fosters a culture of trust and openness within the organization.
Competitive Advantage
SCA also provides a tangible competitive advantage, enabling organizations to streamline operations and reduce costs.
In today’s fast-paced and competitive business environment, the insights gleaned from a thorough spend analysis can be the difference between leading the market and falling behind.
By identifying cost reduction and process improvement opportunities, companies can position themselves more favorably within their industry.
Sustainability and CSR
SCA can contribute toward sustainability and Corporate Social Responsibility (CSR) objectives.
Organizations can make more environmentally friendly purchasing decisions by identifying and optimizing spending on goods and services.
This can involve choosing suppliers who adhere to sustainable practices or reducing waste through more efficient procurement processes.
In this way, SCA impacts the bottom line and supports broader societal and environmental goals.
Challenges and Considerations
While the benefits of SCA are clear, several challenges may arise during its implementation.
Data Quality Issues
One of the primary challenges in implementing Spend Cube Analysis is ensuring the quality of the data collected.
Inaccuracies, incomplete records, and inconsistent data formats can significantly hinder the effectiveness of SCA.
Without high-quality data, it’s challenging to gain accurate insights into spending patterns and make informed decisions.
Addressing these issues may require investing in better data management systems or training staff to ensure the integrity of data collection and entry processes.
Complexity of Data Categorization
The categorization process in SCA can be complex, especially for organizations with a wide range of products and services.
Developing a standardized categorization system that accurately reflects the organization’s spending while being flexible enough to accommodate future changes is challenging.
This process often requires significant time and expertise to ensure that the categorization system enhances the analysis rather than confounding it.
Resistance to Change
Implementing SCA often leads to significant changes in procurement policies and practices, which can be met with resistance from within the organization.
Employees may be reluctant to adopt new processes, especially if they perceive them as burdensome or unclear about the benefits.
Managing this resistance requires effective change management strategies, including communication, training, and involving stakeholders in the SCA process to ensure buy-in and support.
It’s Hip (and Strategic) to Be Square
Spend Cube Analysis is more than just a financial tool; it’s a strategic asset that can significantly impact an organization’s bottom line.
By providing a comprehensive view of spending, SCA enables businesses to make informed decisions that drive cost savings and operational efficiencies.
Whether you’re a financial analyst, entrepreneur, or business owner, exploring the application of SCA in your organization could be the key to unlocking new levels of financial performance and competitive advantage.
")

")
