What's PLANERGY?

Modern Spend Management and Accounts Payable software.

Helping organizations spend smarter and more efficiently by automating purchasing and invoice processing.

We saved more than $1 million on our spend in the first year and just recently identified an opportunity to save about $10,000 every month on recurring expenses with PLANERGY.

King Ocean Logo

Cristian Maradiaga

King Ocean

Download a free copy of "Preparing Your AP Department For The Future", to learn:

  • How to transition from paper and excel to eInvoicing.
  • How AP can improve relationships with your key suppliers.
  • How to capture early payment discounts and avoid late payment penalties.
  • How better management in AP can give you better flexibility for cash flow management.

Business Intelligence: What Is It and Why It Is Important

Business Intelligence

Strategic thinking is a cornerstone of successful business development.

In today’s information-driven economy, you need reliable and actionable data to formulate winning business processes and plans for your company’s initiatives, from finance & accounts payable to procurement to marketing & sales.

Tapping into the power of business intelligence (BI) is the key to collecting, analyzing, and leveraging all of the information you need for optimal predictive decision-making, identifying promising opportunities, and improving competitive advantage.

Modern business intelligence is about more than tracking data in spreadsheets.

What is Business Intelligence?

Business Intelligence (BI) is a technology-driven process that leverages software and services to transform raw data into actionable insights.

These insights can help businesses make strategic, tactical, and operational decisions.

BI tools access and analyze data sets from all the big data your business collects, then present analytical findings in reports, summaries, dashboards, graphs, charts, and maps to provide users with detailed intelligence about the state of the business.

In simpler terms, BI is like the GPS of a company. It helps businesses convert raw data into meaningful information, much like how a GPS turns geographical data into a navigable route.

This information allows companies to understand their own strengths and weaknesses and make strategic decisions accordingly.

BI serves to help business operators make data-driven decisions. It offers a way for businesses to examine data to understand trends and derive insights by streamlining the effort needed to search, merge, and query the data necessary to make sound business decisions.

A Business Intelligence Analyst translates complex data into actionable information for their company.

They organize, analyze, and visualize this data to help businesses identify trends, improve business practices, and make informed decisions.

Becoming a BI analyst generally requires a degree in a related field, such as computer or data science or business administration.

Most BI analyst positions also require experience in data analysis or related fields.

Key skills include analytical thinking, communication, and familiarity with BI software.

Difference Between Business Intelligence and Analytics

Business Intelligence (BI) and analytics are data management solutions businesses use to make strategic decisions.

However, they serve different purposes and focus on different areas of data analysis.

  • Business Intelligence

    BI primarily focuses on descriptive analytics, which is about historical analysis to answer the question, “What happened?” It uses past and current data to provide actionable information about the state of the business.

    Through BI, companies can track their performance, identify trends, and make informed decisions based on their history and current status.

    BI tools typically provide dashboards, reports, and visualizations, enabling decision-makers to see the information in an easily digestible format.

    These insights help businesses understand their performance, customer behavior, and market trends.

  • Analytics

    Analytics, on the other hand, leans more towards predictive and prescriptive analytics. Predictive analytics answers the question, “What could happen in the future?”

    It uses statistical models and forecasting techniques to understand future behavior.

    Prescriptive analytics goes a step further to suggest actions to benefit from predictions and answer the question, “What should we do?”

    Analytics involves the use of advanced statistical methods that allow for a deeper understanding of data.

    It’s not just about understanding what has happened or what is happening but also about predicting what will happen next and what steps should be taken.

    BI helps interpret the past and present of the business, while analytics helps predict and shape the future.

The Five Pillars of Business Intelligence

This pentaacetate of pillars provides a clear route for data as it travels through the BI system.

The five pillars of business intelligence

  1. Data Source(s) provide both existing internal data and unstructured data to be integrated and analyzed.

    They include:

    • Operational and transactional data
    • Master and reference data sources
    • External data sources
    • Unstructured data
  2. Data Integration Services provide the first level of collating and analysis for information collected from the data sources.

    These include:

    • Data Profiling
    • Data integrity management
    • Web-based collection and analysis services
    • Extract, transform, and Load (ETL) services, used to transform unstructured data into useful formats for analysis, viewing, and sharing
  3. Data Management centralizes and stores all information in a single place for universal access, using:

    • Operational and Master data storage
    • Data warehouses
    • Data marts
  4. Reporting and Business Analytics process the collected and integrated data, through:

    • Data mining
    • Ad-hoc analysis
    • Detailed operational analysis and reporting
    • Predictive modeling
    • Financial forecasting
    • Online Analytical Processing (OLAP), a cloud computing-based set of tools used to create useful and detailed breakouts of information to aid in planning and decision making
  5. Information Delivery disseminates the information produced by analysis in real time, in readily and easily interpreted formats, using:

    • Self-service Web portals for business users (both internal (e.g., staff) and external (e.g., vendors))
    • Collaboration platforms
    • Digital dashboards and scorecards
    • Data extracts and abstracts
    • Publications (electronic and physical)
    • Data personalization, refinement, and granulation

Business Intelligence Tools

BI tools analyze historical and current data and present findings in intuitive visual formats, making it easier to identify trends and insights.

These tools save time and resources by automating data collection and analysis processes.

Before it can be parsed and leveraged, information has to be collected.

BI relies on a centralized data warehouse, often supported by an enterprise-wide software platform, to collect, sort, integrate, and store information.

From this hub, raw data (also called unstructured data) can be refined using data mining and predictive analytics to establish relationships between disparate sources of potentially useful and relevant information.

Some organizations also use smaller data hubs, called data marts, instead of (or in tandem with) data warehousing.

These units serve the same purpose as their larger kin, but facilitate data management by allowing specific and discrete data pools for different business processes, initiatives, and goals.

To harvest and leverage useful data from the infosphere, business intelligence uses software tools (often enhanced by cloud computing and artificial intelligence) to perform a number of data analytics functions on the information stored in the data warehouse, including:

  • Ad Hoc Data Analysis, used to answer a single, specific question or solve a single problem in detail.

  • Data Visualization, which renders essential business data in readily-digestible formats such as infographics, reports, charts, graphs, and presentations.

  • Business Reporting, which often incorporates data visualization to convey essential information to stakeholders and provide total transparency for decision-makers.

  • Performance Analysis and Benchmarking, to measure and improve internal business operations and important key performance indicators (KPIs) such as vendor compliance and processing time for orders.

  • Data Management (also known as knowledge management), used to develop and improve training, compliance, and general information distribution through the creation of a searchable, regularly updated, centralized document library.

Artificial Intelligence (AI) and machine learning are transforming BI by automating data collection and analysis, thereby reducing human error.

AI-powered BI systems can process complex data sets and deliver insights at a speed that humans could not possibly achieve.

This allows businesses to respond quickly to changes in their environment.

Benefits of Business Intelligence

When used correctly, investing in business intelligence solutions can provide many benefits for your business.

Benefits of business intelligence

  • Improved Decision Making

    One of the most significant benefits of BI is that it enables improved decision-making.

    With real-time data analysis, businesses can make quick, informed decisions that keep them ahead of the competition.

    This can be particularly valuable in fast-moving industries where timely decision-making is critical.

  • Increased Operational Efficiency

    BI can streamline business processes and reduce redundancy, increasing operational efficiency.

    By automating data collection and analysis, BI allows businesses to save time and resources that can be better utilized elsewhere.

  • Identifying Market Trends

    BI can help businesses identify market trends and stay competitive.

    By analyzing data from various sources, BI tools can spot trends and patterns that might otherwise go unnoticed.

    This insight can inform strategic planning and help businesses adapt to changing market conditions.

  • Cost Savings

    With more efficient processes and better decision-making, businesses can reduce waste and save money.

    For instance, BI can help businesses identify underperforming products or inefficiencies in their supply chain that are costing them money.

Challenges of Business Intelligence

Challenges of business intelligence

  • Data Quality

    One of the primary challenges faced is ensuring the quality of data.

    BI systems rely on the input data to generate insights and make predictions.

    If the data feeding into it is unclean or low-quality, the output will also be faulty.

    Hence, businesses must ensure that the data they collect is accurate, complete, and consistent to get the most out of their BI tools.

  • Data Integration

    Another significant challenge is data integration.

    Businesses often have multiple sources of data, from internal databases to external feeds.

    Combining these disparate data sources into a single, coherent system for analysis can be complex and challenging.

    It often requires robust data integration tools and skilled data engineers to ensure seamless integration.

  • Cost

    Implementing a BI solution can be expensive, especially for small businesses.

    This includes the cost of the modern BI software itself and associated costs like training staff, integrating data, and maintaining the system.

    These costs can be a significant barrier for businesses with limited resources.

  • Resistance to Change

    Like any new process, introducing BI can meet resistance from employees who are comfortable with traditional working methods.

    This resistance can slow down BI implementation and limit its effectiveness.

    Overcoming this requires strong leadership, clear communication about the benefits of BI, and comprehensive training.

Best Practices for Business Intelligence

Best practices for business intelligence

  • Define Clear Goals

    Before implementing BI, it’s crucial to define clear goals.

    What do you want to achieve with your BI tool?

    Whether improving decision-making, identifying market trends, increasing efficiency, or reducing costs, having a clear objective will guide your BI implementation and help you measure its success.

    Understanding your goals will also help you determine the metrics by which to measure your success.

  • Cleanse Your Data

    The quality of your BI output is only as good as the quality of your input data.

    Therefore, ensuring that the data you’re feeding into your BI tool is clean and accurate is essential.

    This might involve cleaning up historical data and setting up processes to ensure future data quality.

    Evaluate Business Intelligence Platforms and Analytics Tools

    Before choosing the business intelligence software and analytics tools you want to use, test multiple options.

    No two tools are created equally.

    While pricing and budget should be part of the equation, ultimately, it may be worth paying more for apps that are easier to use or ones that specifically align with your business strategy.

  • Train Your Staff

    The best BI tool in the world won’t be useful if your team doesn’t know how to use it effectively.

    Ensure your staff is trained on using the BI tools and understands how to interpret the results.

    This might involve formal training sessions, ongoing support, and resources like user manuals or online help centers.

    It may also mean expanding your staff to add data scientists to the team.

  • Implement Gradually

    Implementing BI is a significant change and can be overwhelming if done all at once.

    A better approach is to start small and gradually expand your BI capabilities.

    This could mean starting with one aspect of your business, like sales or customer data, and then expanding to other areas once you’re comfortable with the BI tools.

Examples of BI in Practice

BI has revolutionized the way businesses operate, providing crucial insights that drive decision-making and strategic planning.

Here are some real-world examples of how different companies use BI to enhance their operations.
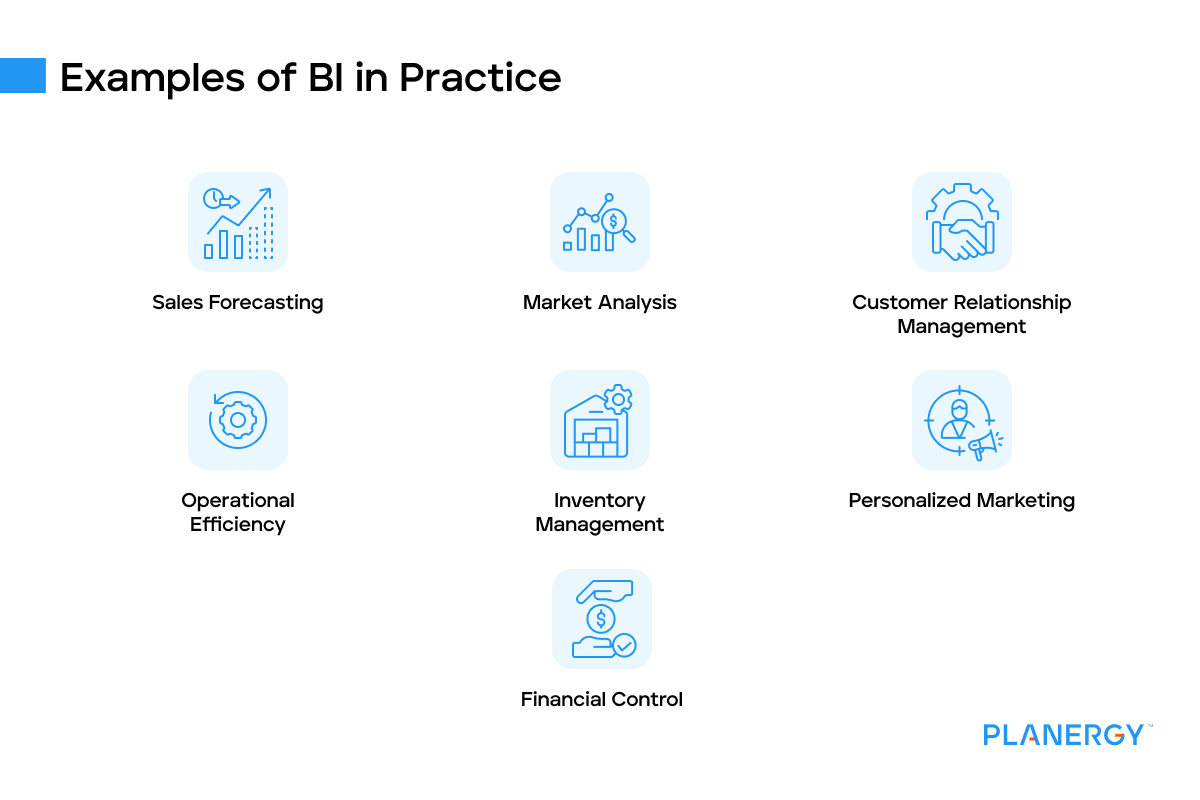
Examples of BI in practice

  • Sales Forecasting

    Companies like Coca-Cola use BI tools to analyze historical sales data and market trends to predict future sales.

    This enables them to efficiently manage their production and inventory, align their sales team’s efforts with market demand, and set realistic sales targets.

    By accurately forecasting sales, they can avoid stockouts and overstocks, ensuring customer satisfaction while optimizing costs.

  • Market Analysis

    Amazon is a prime example of a company that uses BI for market analysis.

    They analyze vast amounts of data from various sources, including sales data, customer reviews, and social media, to understand market trends and consumer behavior.

    This allows Amazon to identify new product or service opportunities, understand the competitive landscape, and make strategic decisions that drive growth.

  • Customer Relationship Management

    Starbucks uses BI to enhance its customer relationship management.

    By analyzing customer data, including purchase history and feedback, Starbucks can understand individual customer preferences and behavior.

    This allows them to personalize their marketing messages, offer targeted promotions, and improve their product offerings, increasing customer loyalty and satisfaction.

  • Operational Efficiency

    Companies like Uber use BI to improve operational efficiency.

    For instance, Uber analyzes data on trip times, driver availability, and traffic conditions to optimize its ride-hailing service.

    This allows Uber to reduce customer wait times, maximize driver utilization, and enhance overall service efficiency.

  • Inventory Management

    Walmart, a retail giant, uses BI to manage its inventory effectively.

    By analyzing sales data, supply chain information, and store inventory levels, Walmart ensures it has the right products in the right place at the right time.

    This improves customer satisfaction by preventing out-of-stock situations and reduces costs associated with excess inventory.

  • Personalized Marketing

    Netflix is a great example of a company using BI for personalized marketing.

    They analyze customer viewing history and preferences to provide personalized movie and TV show recommendations.

    This enhances the viewer’s experience, increases viewer engagement, and helps Netflix retain its subscribers.

  • Financial Control

    BI can also be used to maintain financial control within a company.

    For example, American Express uses BI to analyze transaction data for patterns and trends.

    This enables them to detect fraudulent transactions quickly, reducing financial risk.

Why Business Intelligence Matters

Faster and more strategic decision-making is the core of effective business intelligence.

BI systems function as decision support systems, using data integration and statistical analysis to identify and overcome challenges, smooth out procedural roadblocks to optimize business processes, and take advantage of emerging market opportunities.

In addition to their strategic value, business intelligence tools strengthen collaboration, boost engagement and buy-in from staff and stakeholders alike, and provide a basis for intangible benefits such as improved morale through automation and risk reduction.

A Smarter Way to Strategize

We’re all floating in a sea of information, and business intelligence can mean the difference between sink and swim for your company.

Building an effective and reliable cloud-based BI system gives you the insight you need to make more profitable decisions, improve overall business performance, tap into opportunities you might have otherwise missed, and ensure your business is working smarter—not harder.

What’s your goal today?

1. Use PLANERGY to manage purchasing and accounts payable

We’ve helped save billions of dollars for our clients through better spend management, process automation in purchasing and finance, and reducing financial risks. To discover how we can help grow your business:

2. Download our guide “Preparing Your AP Department For The Future”

Download a free copy of our guide to future proofing your accounts payable department. You’ll also be subscribed to our email newsletter and notified about new articles or if have something interesting to share.

3. Learn best practices for purchasing, finance, and more

Browse hundreds of articles, containing an amazing number of useful tools, techniques, and best practices. Many readers tell us they would have paid consultants for the advice in these articles.

Business is Our Business

Stay up-to-date with news sent straight to your inbox

PLANERGY LOGO

Sign up with your email to receive updates from our blog