What's PLANERGY?

Modern Spend Management and Accounts Payable software.

Helping organizations spend smarter and more efficiently by automating purchasing and invoice processing.

We saved more than $1 million on our spend in the first year and just recently identified an opportunity to save about $10,000 every month on recurring expenses with PLANERGY.

King Ocean Logo

Cristian Maradiaga

King Ocean

Download a free copy of "Preparing Your AP Department For The Future", to learn:

  • How to transition from paper and excel to eInvoicing.
  • How AP can improve relationships with your key suppliers.
  • How to capture early payment discounts and avoid late payment penalties.
  • How better management in AP can give you better flexibility for cash flow management.

Chart Of Accounts: What It Is, How It Works, and Best Practices

Chart Of Accounts_ What It Is, How It Works, and Best Practices Title Image

KEY TAKEAWAYS

  • A chart of accounts (COA) is the foundational structure of a company’s financial system, organizing every transaction into categorized accounts that feed the general ledger and support accurate financial reporting.
  • All COAs are built around the five core account categories—assets, liabilities, equity, revenue, and expenses—with numbering formats and level of detail vary by business.
  • Preparing an effective COA requires assessing business needs, categorizing accounts properly, establishing a consistent numbering structure, clearly describing each account, and regular review.
  • Integration with accounting or ERP software works best when the COA is standardized, carefully mapped, error-checked, imported correctly, and verified, ensuring clean data and smooth reporting across systems.
  • Common challenges include over-complicating the COA, not providing enough detail, deleting accounts mid-year, and managing multiple system inconsistencies, all of which can disrupt financial accuracy and reporting clarity.
  • The COA feeds every financial statement, supports transparency, ensures compliance with accounting standards, and enables better decision-making by providing a clear, organized view of how money flows through the business.

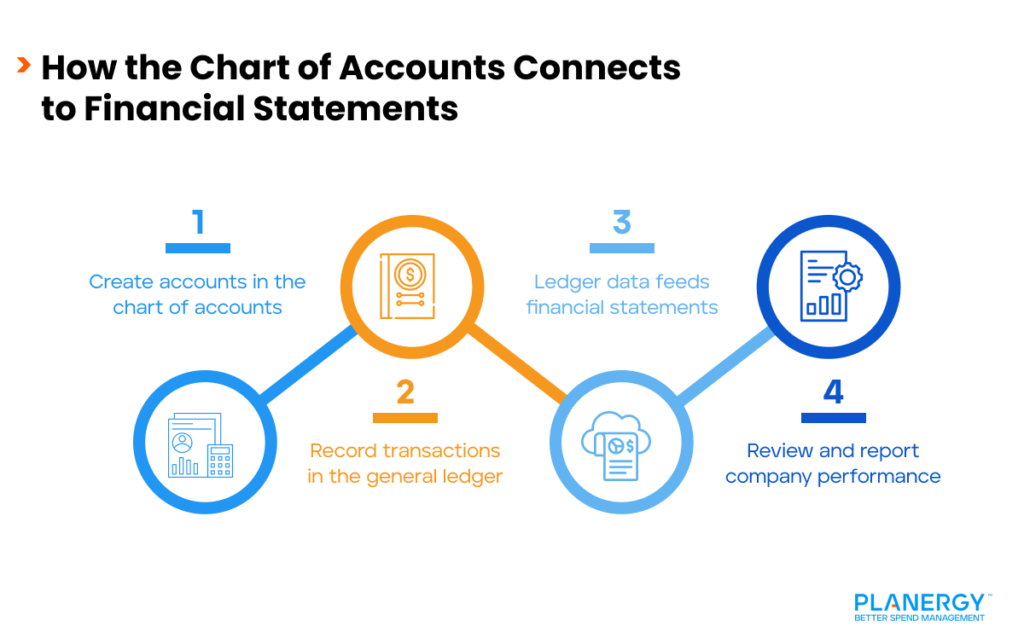
Every time you post an invoice, record a customer payment, or pay a credit card bill, you record those transactions to your general ledger, which contains a list of specific accounts that encompass your chart of accounts.

But what exactly is a chart of accounts?

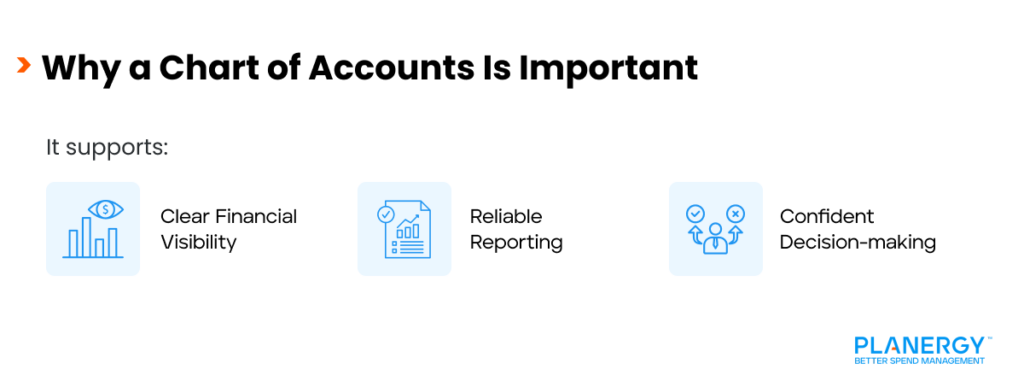
We’ll explain exactly what the chart of accounts is, why it’s so important, and how to prepare one for your business.

What is a Chart of Accounts?

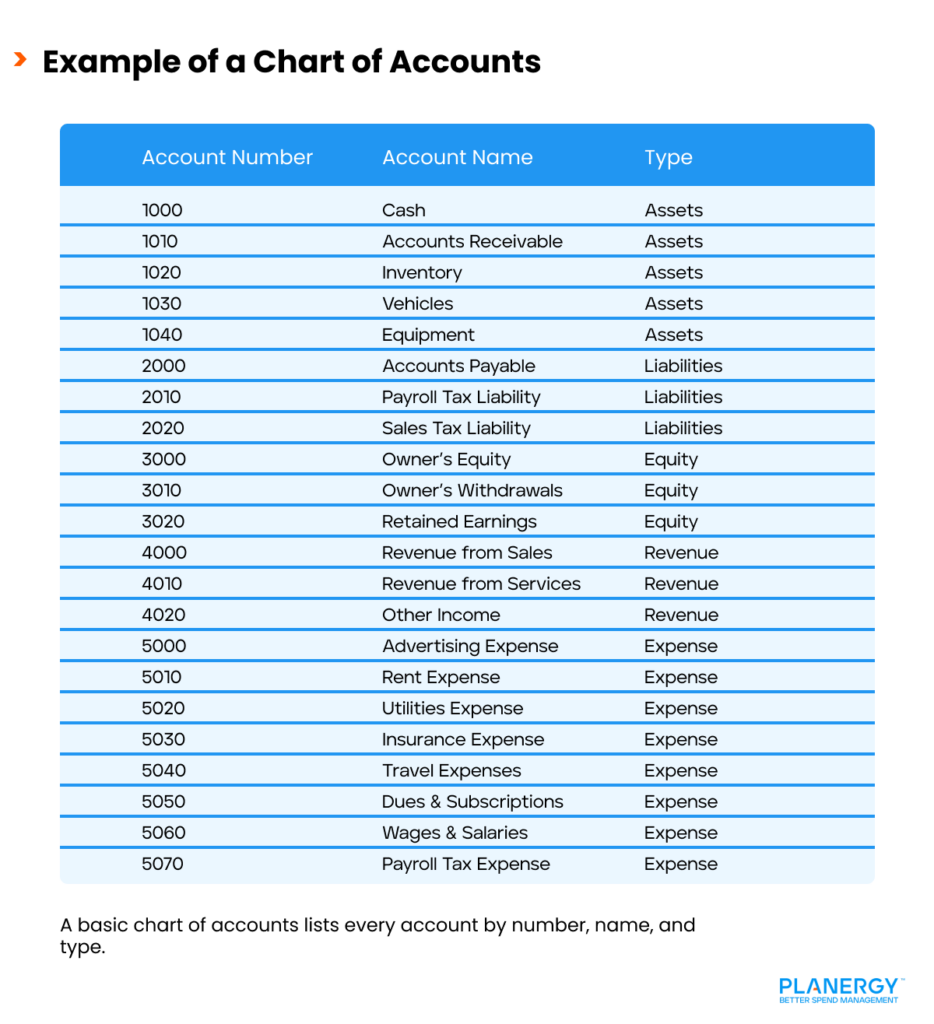
The chart of accounts is the repository for all of your financial accounts because every bookkeeping transaction made in your business is assigned to an account in your chart of accounts.

What Is a Chart of Accounts_ 2

While your general ledger may serve to ‘house’ all of your company’s financial transactions, the chart of accounts is the foundation for that house.

The 5 Basic Charts of Accounts Categories

Five basic categories make up all charts of accounts, regardless of business type or size.

The Five Categories of a Chart of Accounts

Asset Accounts

Asset accounts represent anything of value that is owned by the business and include current assets such as cash, accounts receivable, equipment, petty cash, prepaid expenses, and inventory.

Asset accounts also include fixed assets such as real estate and intellectual property. Asset accounts are found on a balance sheet.

Liability Accounts

Liability accounts represent anything that your business owes and include current liabilities or short-term liabilities like accounts payable, wages payable, accrued expenses, notes payable, and unearned revenue.

Liability accounts also include long-term liabilities such as loans. Liability accounts are balance sheet accounts.

Equity Accounts

Sometimes called owner’s equity, an equity account represents the true value of the business after all liabilities have been subtracted from all assets.

Both common stock and preferred stock are considered equity as well. Equity accounts are found on a balance sheet.

Revenue Accounts

Revenue accounts represent the income your business earns from the sale of products, services, and rental income. Investment income is also considered a revenue account. Revenue accounts are found on an income statement.

Expense Accounts

Expense accounts are operating expenses such as rent, utilities, insurance, and office supplies. Expense accounts are found on an income statement.

Is There a Single Chart of Accounts Format?

There is no universal format for a chart of accounts, but many businesses opt for a four-digit structure that can be customized to suit almost any business type.

Example Chart of Accounts Number Ranges

For instance, the five main chart of accounts categories can be broken down as follows:

Assets: 1000 – 1999

Liabilities: 2000 – 2999

Equity: 3000 – 3999

Revenue: 4000 – 4999

Expenses: 5000 – 5999

Most small businesses can use a simple COA, while larger companies may use subcategories to better categorize financial transactions.

Whatever structure you decide works best for your business, it’s important to maintain consistency from accounting period to accounting period.

How to Prepare a Chart of Accounts

Most automated accounting systems offer a default chart of accounts that you can utilize, with the option to add accounts as needed.

How to Prepare a Chart of Accounts

If you’re creating a custom chart of accounts from scratch, you’ll want to follow these steps:

  1. Assess your business needs, including your industry type, what information you’ll need to track, and how detailed the chart of accounts needs to be.
  2. Categorize your accounts properly. For example, cash would go under assets, accounts payable would go under liabilities, and sales income would go under revenue.
  3. Decide your number structure based on the hierarchy of your accounts. For example, assets would start with 1000, liabilities with 2000, and so forth. At this time, you should also decide if you need to track additional details for your accounts.
  4. Provide a detailed description for each account. For example, if you have two bank accounts, one checking and one savings, be sure to identify them properly in the chart of accounts to prevent mis-postings.
  5. Enter or upload your chart of accounts into your accounting software application.

    It’s important to regularly review your chart of accounts to ensure that categories are still relevant or add accounts if necessary.

    For instance, if you start with a relatively simple chart of accounts, you may find that you need to add accounts as your business grows and evolves.

What is an Example of a Chart of Accounts?

The following chart represents a simple chart of accounts that any business can use or customize to suit their needs.

Example of a Chart of Accounts

You can customize your chart of accounts to suit your business. For instance, the chart of accounts for a manufacturing business will be different than one for a service-based business.

Meanwhile, larger businesses with multiple departments or locations should consider adding segments for more comprehensive tracking.

Adding Location Segments to the Chart of Accounts 

Let’s say that your company has multiple locations and you need to track financial activity for all of them.

Location A – 01

Location B – 02

Location C – 03

When creating or customizing your chart of accounts, you would set it up as follows:

1000-01 Cash

1001-02 Cash

1001-03 Cash

You would continue to do that for each account in the chart of accounts, which ultimately allows you to track transactions by location.

Keep in mind that the ability to create additional segments can vary, depending on the accounting software you’re using.

Is a Chart of Accounts Similar to a Balance Sheet?

A chart of accounts is not similar to a balance sheet. A chart of accounts serves as a repository for all accounts, providing a list of all accounts for the company.

Chart of Accounts vs Balance Sheet

A chart of accounts does not display account balances nor provide any indication of the financial health of a business.

On the other hand, a balance sheet provides a snapshot of a company’s financial health. It provides management and interested investors with detailed financial information, including asset, liability, and equity totals, at any given time.

Best Practices for Integrating a Chart of Accounts with Accounting Software or ERP Systems

Automated accounting software applications and enterprise resource planning (ERP) systems provide a default chart of accounts that can be utilized from day one.

Integrating a Chart of Accounts with Software 

However, if you’re migrating over from another system, or have created a custom chart of accounts, most software applications provide a way for you to upload and integrate your existing chart of accounts within the new application.

Standardize the Chart of Accounts Structure

Create a hierarchical account structure that follows industry standards by numbering and naming accounts consistently. Doing so will reduce possible data transfer errors.

Map the Chart of Accounts Carefully

Most accounting software applications require that your chart of accounts file be in spreadsheet format, such as CSV (Comma Separated Values) or Excel (XLS/XLSX). Be sure to check that all the necessary columns are included on your spreadsheet including:

  • Account name
  • Account type
  • Detail type
  • Account number
  • Sub accounts (if any)

Before importing, be sure to check for duplicate accounts and possible formatting issues.

Navigate to the Import Function in Your Software Application

Once you’re in the correct area, you can click on the Upload option. Some software applications will require you to map the columns in your spreadsheet to the corresponding columns in the software application.

Import the File

Quickly review the file for possible issues. If none are found, you’re ready to import the spreadsheet file.

Verify the Imported Data

Once the file has been imported, verify it for accuracy and make any changes if needed.

Challenges in Creating a Chart of Accounts

Creating a chart of accounts is fairly straightforward for most businesses, but there are some challenges you may encounter.

Challenges in Creating a Chart of Accounts with Accounting Software or ERP Systems

The Urge to Over-Complicate the Process

A streamlined chart of accounts provides you with all the financial details you’ll need to create accurate financial statements.

However, you may have the urge to create too many accounts or sub-accounts, resulting in an over-complicated chart of accounts.

For instance, you can track a host of supplies in office supplies without tracking each supply category separately. Remember to keep it simple and just use the accounts that you need.

Not Enough Detail

On the other side of the spectrum are those who overly simplify the process by using accounts that are too broad, such as ‘miscellaneous expenses’.

While you don’t have to track every type of supply you purchase, you don’t want to lump your utility expenses in with your travel expenses.

Deleting Accounts

The chart of accounts ensures financial data consistency. That means that accounts should never be deleted mid-year, since it will directly impact your financial statements.

Instead, wait until the end of the year to delete old accounts and make sure that any balances are properly transferred to a new account.

How the Chart of Accounts Connects to Financial Statements

Every piece of information found on your income statements uses your chart of accounts structure.

How the Chart of Accounts Connects to Financial Statements 

For instance, when you run an income statement, the data found on the income statement are directly pulled from the general ledger, which is made up of accounts in your chart of accounts.

It is impossible to have a general ledger account without that number being in the chart of accounts.

As an example, when you created your cash account in the chart of accounts, that same account is now found in the general ledger. When you make a deposit or pay a bill, the balance of that account is adjusted accordingly.

Without the chart of accounts, there is no general ledger, and without the general ledger, there is no way to record your financial transactions.

Furthermore, without the ability to record your company’s financial transactions, it’s impossible to produce a financial statement of any kind.

Why Financial Reporting is Important in Business

Accurate financial reporting is essential for any business as a cornerstone of financial transparency.

Why Financial Reporting Matters

Financial reporting provides management teams, investors, and other stakeholders with a transparent view of the financial health of a business.

Other benefits include:

More Informed Decision-Making

Imagine deciding to stop production on a product without knowing if that product is selling.

It’s impossible to identify potential weak spots, create a budget or effectively evaluate potential growth and investment opportunities without having access to accurate financial numbers.

Regulatory Compliance

Publicly held businesses are required to adhere to established accounting standards such as GAAP (Generally Accepted Accounting Principles) or IFRS (International Financial Reporting Standards) or regulatory requirements, depending on the industry.

It’s impossible to show compliance with these standards without financial statements.

Building Investor Trust

Both potential and existing investors need to access data that provides information on a company’s cash flow and long-term financial health.

Creditors, meanwhile, need to determine a company’s creditworthiness before approving a loan or a line of credit. All of that information is obtained via a company’s financial statements.   

Performance Tracking and Growth Strategies

Business owners use financial statements to monitor company performance over an extended period of time, comparing past and current performance.

Financial statements also allow businesses to compare performance against direct competitors, identify weak spots and make improvements as needed. This makes them a necessity for strategic planning.

Why a Chart of Accounts Is Important

A chart of accounts is the foundation of accurate financial management. A solid chart of accounts structure provides stakeholders with a clear view of a business’s finances, showing where money is coming from and going to.

Why a Chart of Accounts Is Important

A chart of accounts is also necessary for producing accurate financial statements, a necessity for businesses large and small.

Imagine trying to determine the profitability of your business without knowing how much money your products and services have earned, or how much money your business has spent.

Spend a few extra minutes creating the chart of accounts that fits your business. You won’t be sorry.

What’s your goal today?

1. Use PLANERGY to manage purchasing and accounts payable

We’ve helped save billions of dollars for our clients through better spend management, process automation in purchasing and finance, and reducing financial risks. To discover how we can help grow your business:

2. Download our guide “Preparing Your AP Department For The Future”

Download a free copy of our guide to future proofing your accounts payable department. You’ll also be subscribed to our email newsletter and notified about new articles or if have something interesting to share.

3. Learn best practices for purchasing, finance, and more

Browse hundreds of articles, containing an amazing number of useful tools, techniques, and best practices. Many readers tell us they would have paid consultants for the advice in these articles.

Business is Our Business

Stay up-to-date with news sent straight to your inbox

PLANERGY LOGO

Sign up with your email to receive updates from our blog