We saved more than $1 million on our spend in the first year and just recently identified an opportunity to save about $10,000 every month on recurring expenses with PLANERGY.
While the thought of calculating ratios may be intimidating to some, even if you’re not a CPA, accounting ratios can provide you with important information about your business.
These ratios, also known as financial ratios, can be used to measure cash flow, predict profit, and find out how quickly your customers pay you.
What Are Accounting Ratios?
Accounting ratios are calculations that are used to compare results from period to period, or between similar companies.
Numbers used in financial ratios are usually found through analysis of your company’s financial statements, such as your balance sheet and income statement, and in most cases, the formulas for calculating the ratios are simple.
While useful for internal purposes, accounting ratio metrics are also used by creditors and potential investors to gain better insight into the financial health of a business.
Common Ratio Categories
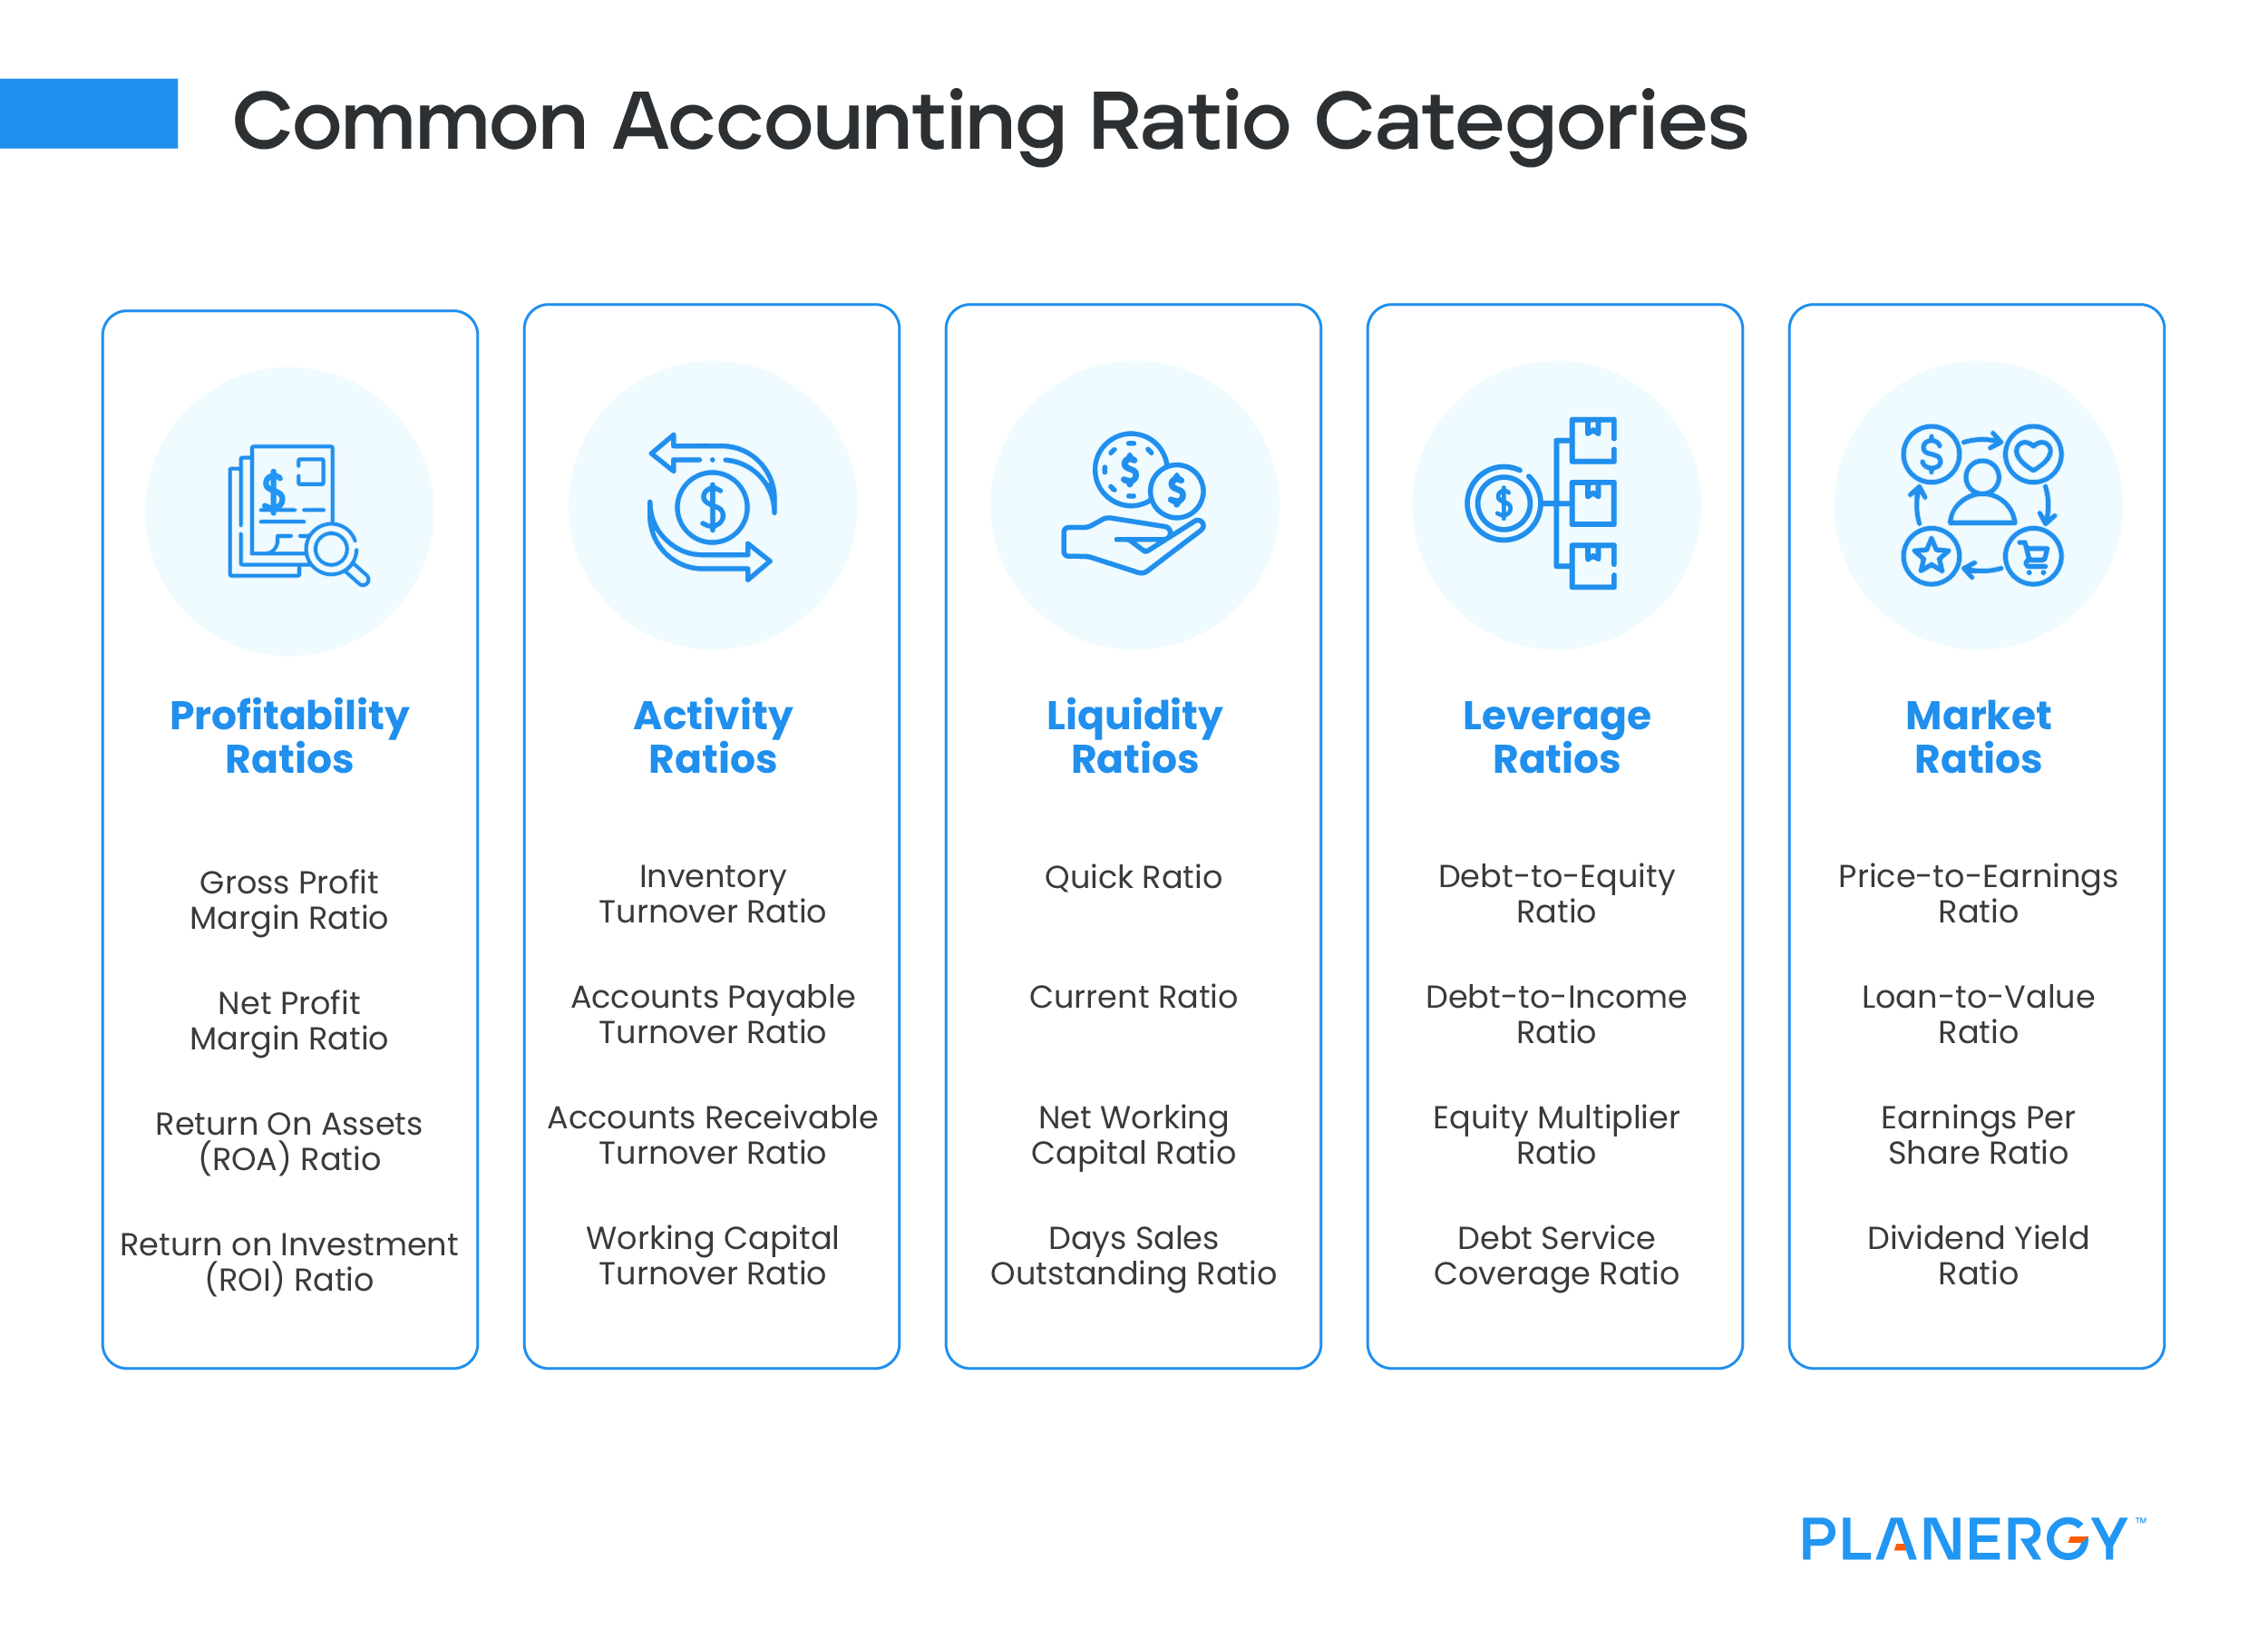
There are numerous accounting or financial ratio categories available to choose from. Below are just a few of the more common ratios that any size business can use. Individual ratios can be grouped in multiple categories as there is overlap in the categorization.
Profitability Ratios
Profitability ratios, also known as performance ratios, are easy to calculate and are used to measure company profitability and expense management.
An activity ratio, also known as an efficiency ratio, is used to determine how efficiently a business uses its assets to generate revenues and manages its liabilities. The asset turnover ratio, accounts receivables turnover ratio, and working capital turnover ratio are all activity ratios.
Liquidity Ratios
Liquidity ratios are used to measure a company’s ability to pay its current debt without additional capital and are used frequently with solvency ratios. Common liquidity ratios include quick ratio, current ratio, net working capital ratio, and days sales outstanding ratio.
Leverage Ratios
Leverage ratios, also known as solvency ratios, measure a company’s ability to pay long-term debt and interest. Leverage ratios are often used by banks and financial institutions, along with potential investors.
Popular with current and potential investors, market ratios look at stock performance and are usually used to predict stock performance and future earnings. Price-to-earnings ratio and a loan-to-value ratio are both market ratios.
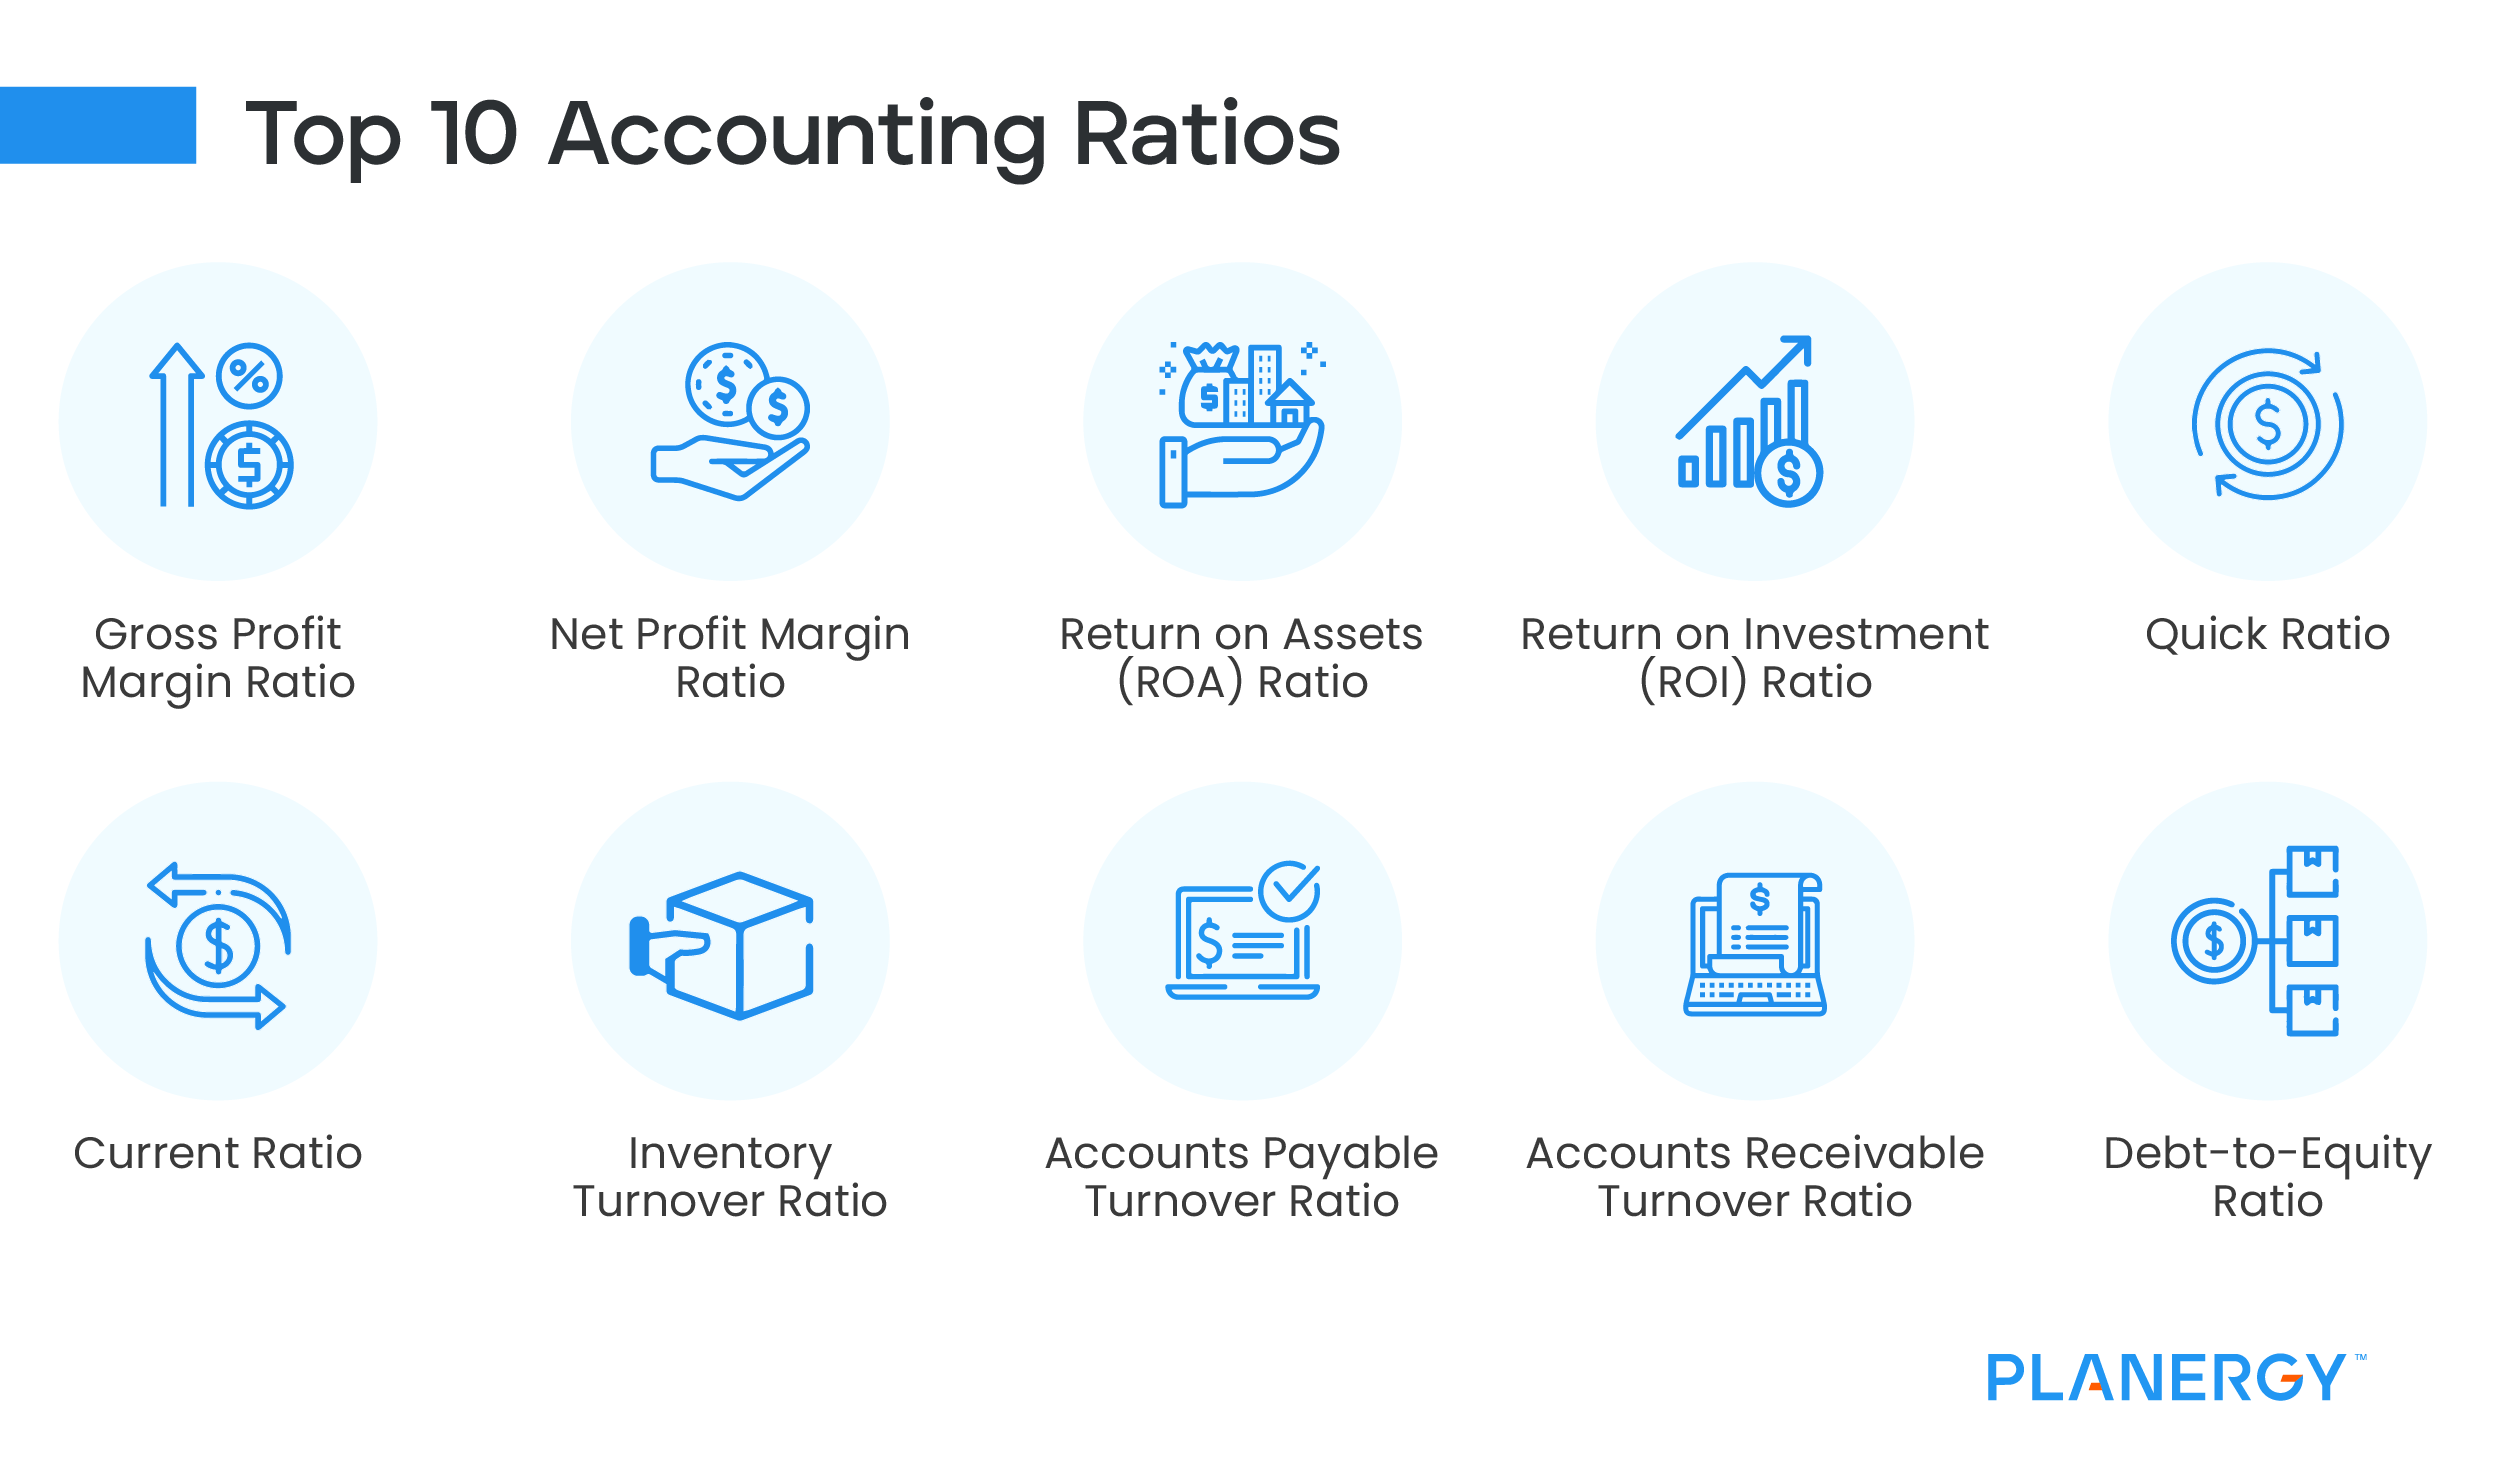
Top 10 Ratios and What the Results Mean
While there are hundreds of ratios that you can run that measure everything from working capital to total debt, we highlighted ten of the most frequently calculated ratios.
Gross Profit Margin Ratio
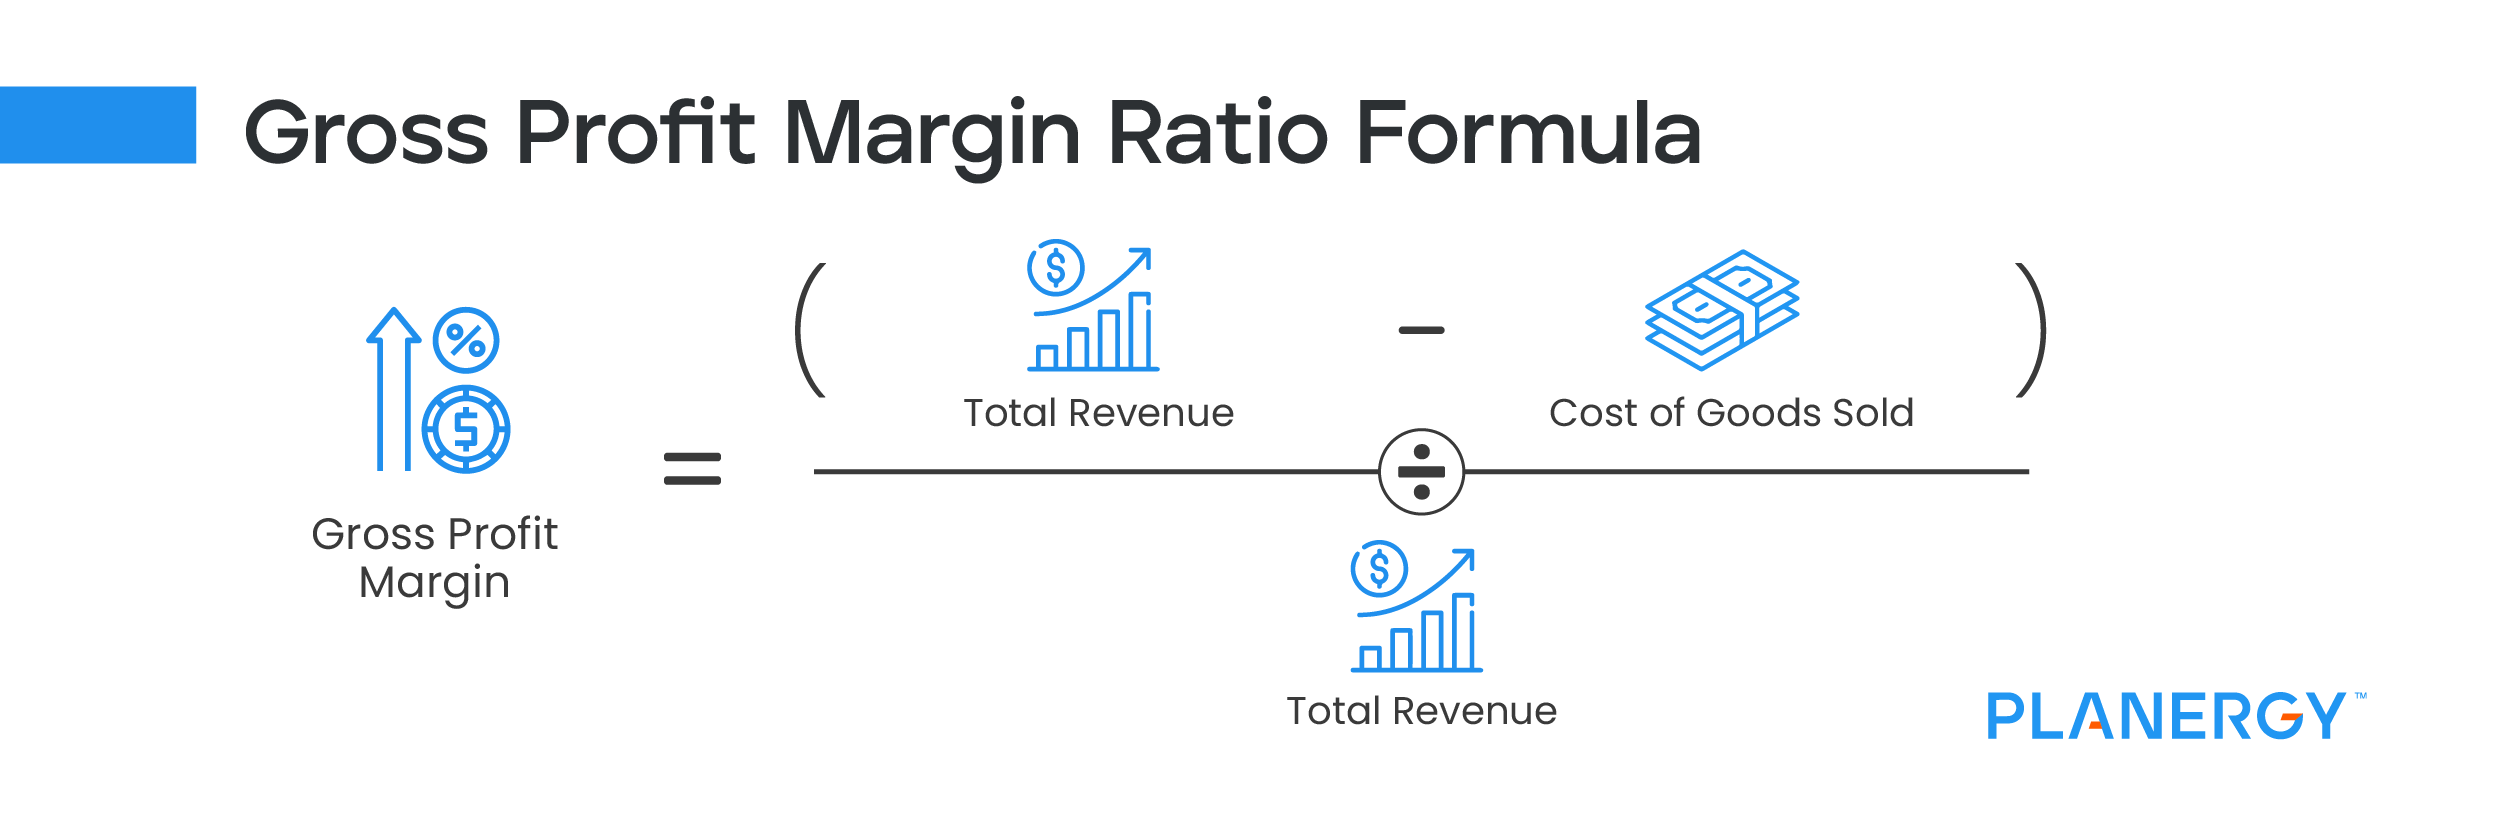
Calculating your gross profit margin ratio is easy and is especially useful for businesses that sell products. A profitability ratio, the gross profit margin shows you how efficiently product sales are managed, and more importantly, how much money is left over to cover operating expenses.
To calculate the gross profit margin ratio, you’ll need your total revenue and cost of goods sold for the period you’re calculating the ratio for. Both numbers can be obtained from your income statement.
Gross Profit Margin Ratio = (Total Revenue – Cost of Goods Sold) / Total Revenue
For example, if your total revenue for 2021 was $6,200,000 while your cost of goods sold was $3,100,000, your ratio calculation would look like this:
($6,200,000 – $3,100,000) / $6,200,000 = 0.50 or 50%
This result means that you earn $.50 for each dollar of net sales. Though like any ratio, totals vary from industry to industry, anything less than 5% is considered a low gross profit margin, while anything over 20% is considered good.
For example, HP Inc. has a gross profit margin ratio of 19.8 as of 7-31-2022, which is down from its previous quarter, where the profit margin was 20.2.
Because the gross profit margin is tracked quarterly, they can see that they are trending up from their 5-year low, when the gross profit margin was 18.2% in October of 2018.
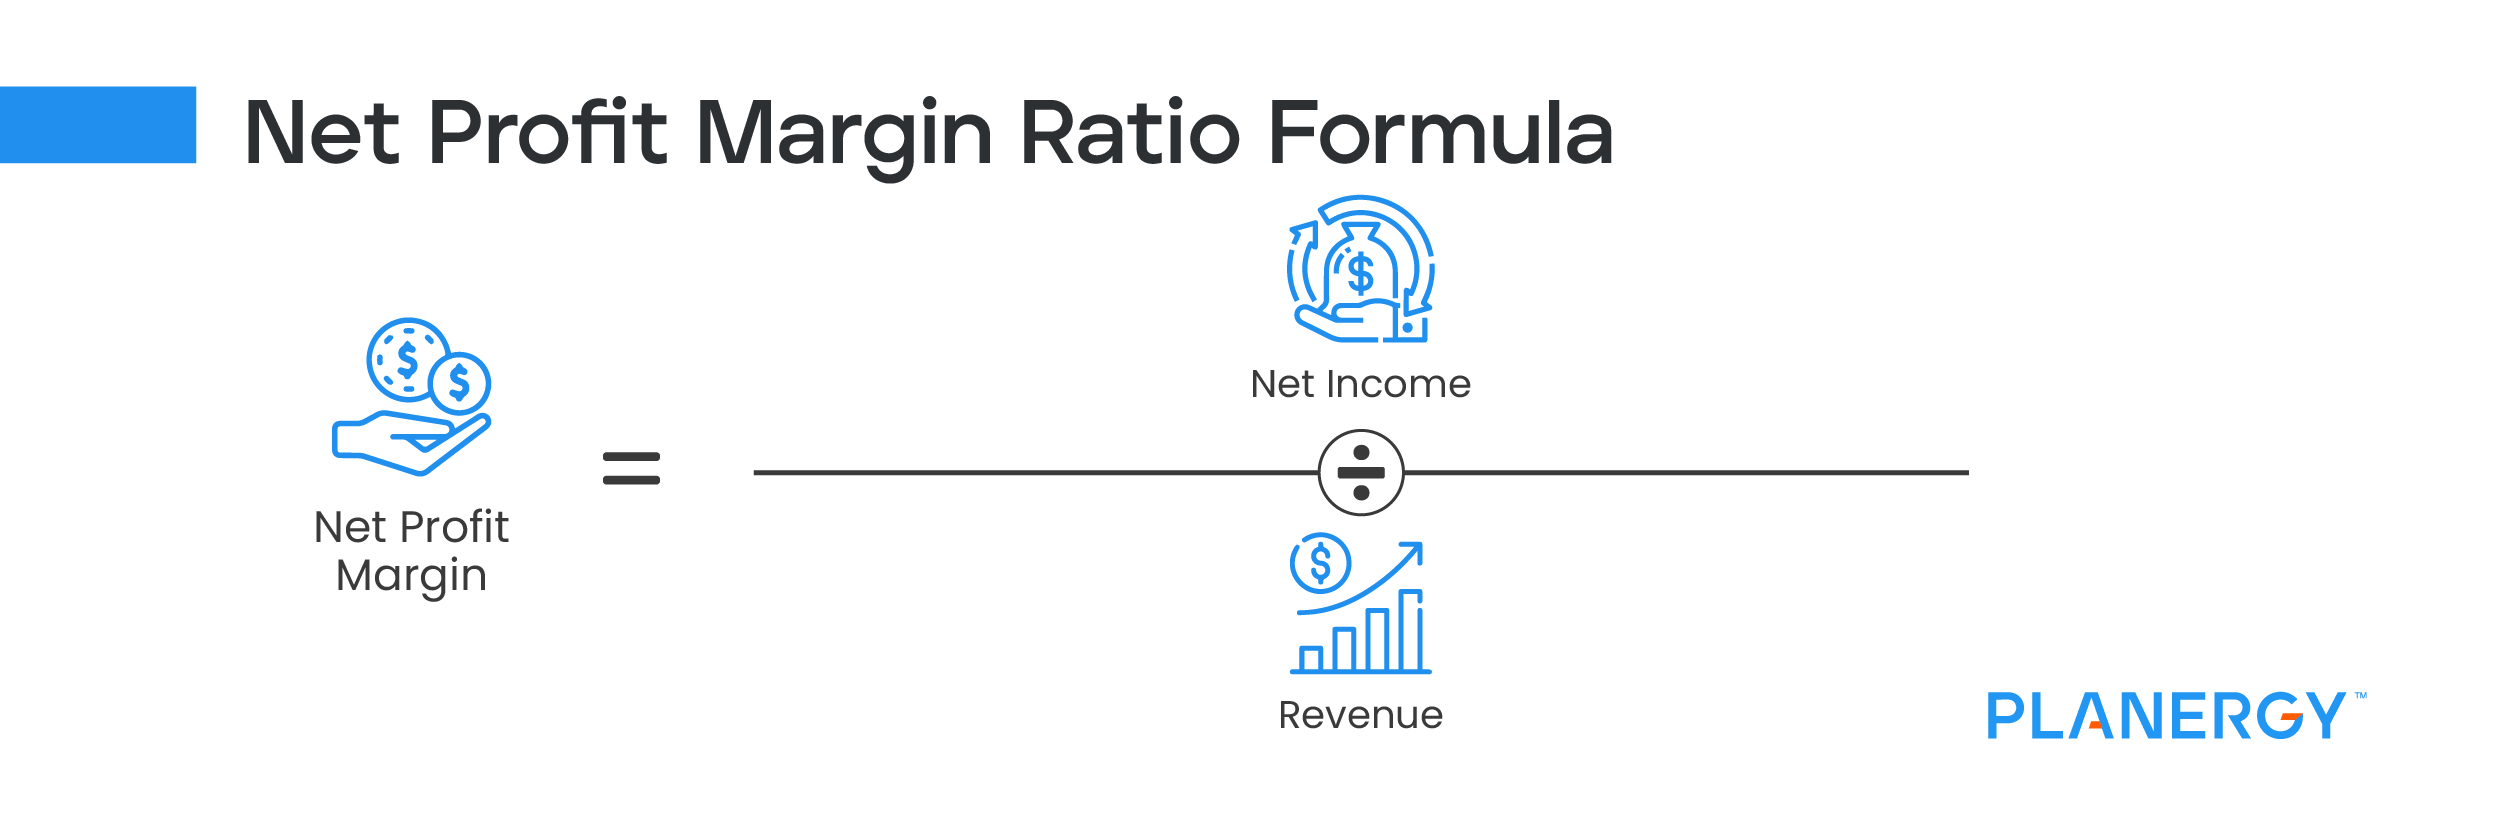
Net Profit Margin Ratio
Net profit margin builds off of your gross profit margin ratio by measuring your total revenue that remains after operating expenses have been paid. A profitability ratio, to calculate the net profit margin ratio, you’ll need your total revenue and total expenses, which can be found on your income statement.
Net Profit Margin Ratio = Net Income / Revenue
For example, if your business earned $1,100,000 in revenue and had $610,000 in expenses for the year, you would calculate your net profit margin ratio as follows:
($1,100,000 – $610,000) / $1,100,000 = 0.44 or 44%
This means after all expenses are paid, your business is earning $.44 for each dollar in revenue. Generally speaking, a net profit margin of 25% or higher is considered good, although this will vary by industry.
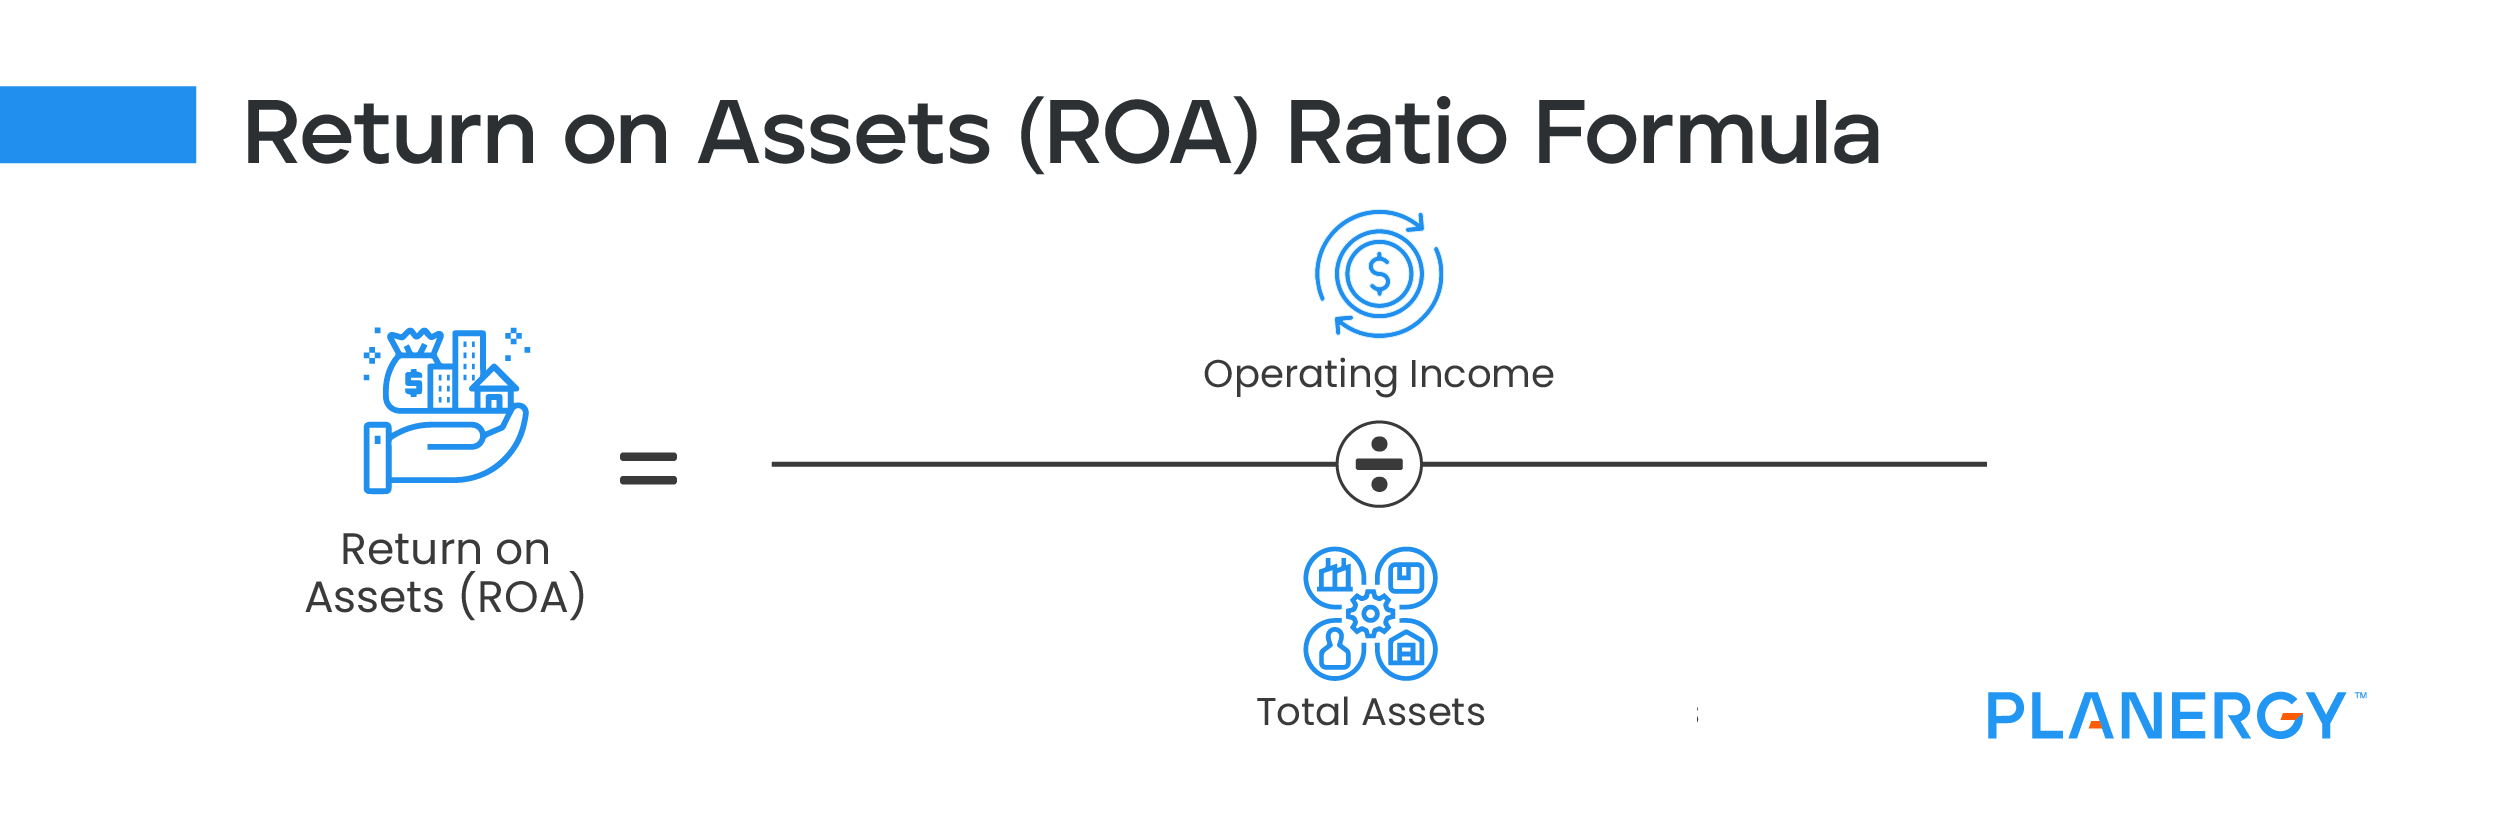
Return on Assets (ROA) Ratio
As a business owner, you know that assets should be used to increase profits. A profitability ratio, the return on assets ratio allows you to see just how well your company uses your assets to increase profits.
You’ll need your net income from an income statement and your total assets from a balance sheet to calculate the return on assets ratio.
Return on Assets Ratio = Operating Income / Total Assets
For this example, let’s say that you have a net income of $750,000 and total assets of $5,100,000. Your calculation would be:
$750,000 / $5,100,000 = 0.14% or 14%
This means that for every dollar invested in assets, you’ve earned $.14.
Generally, an ROA of 5% is considered good, while one over 20% is considered excellent. However, to get a better idea of company performance, it’s best to compare your results with those of similar companies.
For example, In January of 2022, Target posted an ROA of 13.2%, up from a 5-year low in 2019 of 7.2%. In comparison, Walmart’s ROA for the same time frame was 5.8%, while Costco’s was 9.6%. This information helps businesses see how their ROA measures against the competition in their own sector.
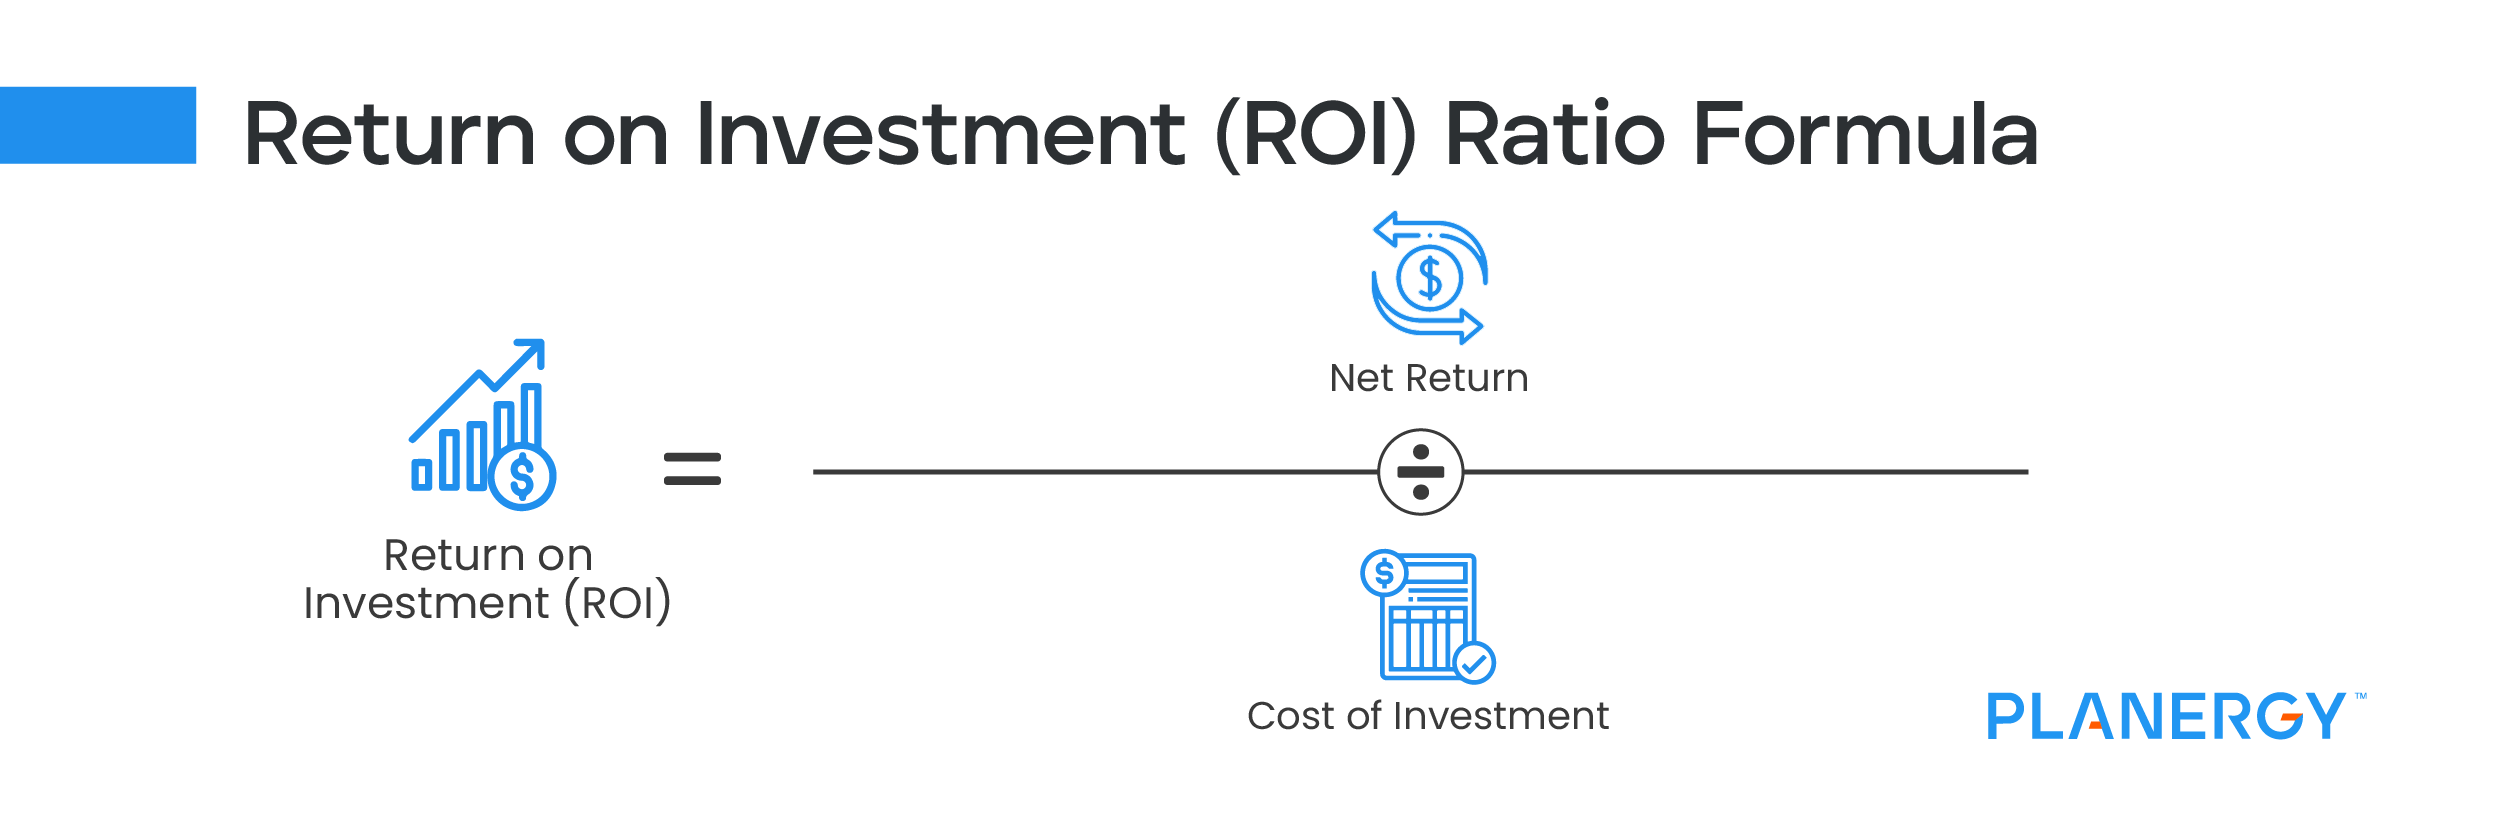
Return on Investment (ROI) Ratio
Particularly useful for startups, the return on investment or ROI ratio is a profitability ratio that gives you a look at how much in profits your original investment has generated.
You’ll need to obtain your total earnings from your income statement and the total of your initial investment from your balance sheet.
Return on Investment Ratio = Net Return / Cost of Investment
For example, you recently ran an aggressive advertising campaign for a new product. The cost of the campaign was $35,000. At the end of the campaign, sales for the new product totaled $280,000, you would calculate your return on investment as follows:
(280,000 – $35,000) / $35,000 = 7
Conventional wisdom states that an ROI of 7% or more is good, while others believe that an ROI of at least 10% is needed to fund proper business growth.
A return on equity (ROE) ratio can also be calculated, which measures a company’s net income divided by shareholder’s equity.
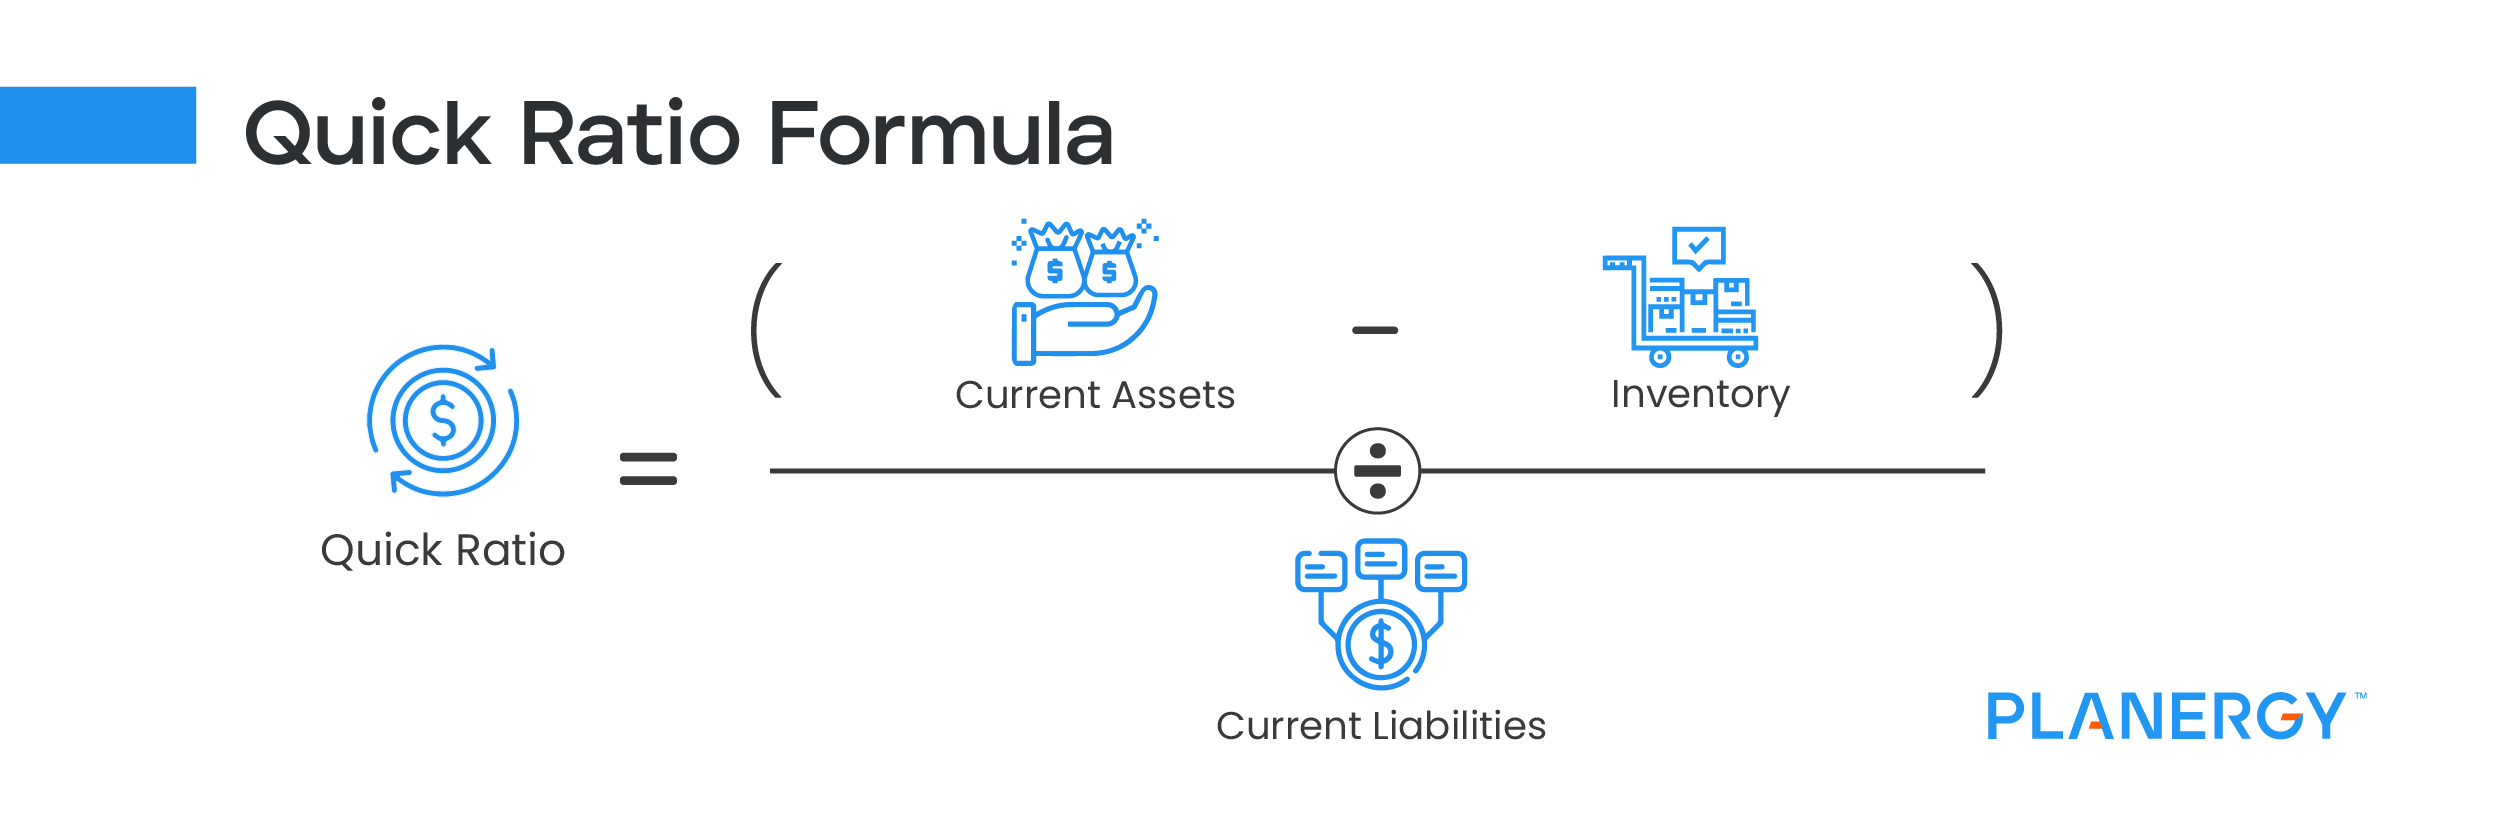
Quick Ratio
If you’re wondering if your business is able to meet its short-term debt obligations, you may want to calculate the quick ratio, also known as the acid test ratio. A liquidity ratio, to get started, you’ll need to obtain your current liquid assets, inventory, and current liability totals, all found on your balance sheet.
Quick Ratio = (Current Assets – Inventory) / Current Liabilities
For example, your current assets, including accounts receivable, total $7,500,000, with inventory of $3,500,000 and liabilities of $1,750,000. Using these numbers, let’s calculate your quick ratio.
($7,500,000 – $3,500,000) / $1,750,000 = 2.28
This result indicates that for every dollar of liabilities your business has $2.28 in assets. A one-to-one ratio is necessary to cover all of your liabilities, but anything more is excess cash. But be careful not to let it get too high. Some investors view a high quick ratio as a business not using its assets aggressively enough.
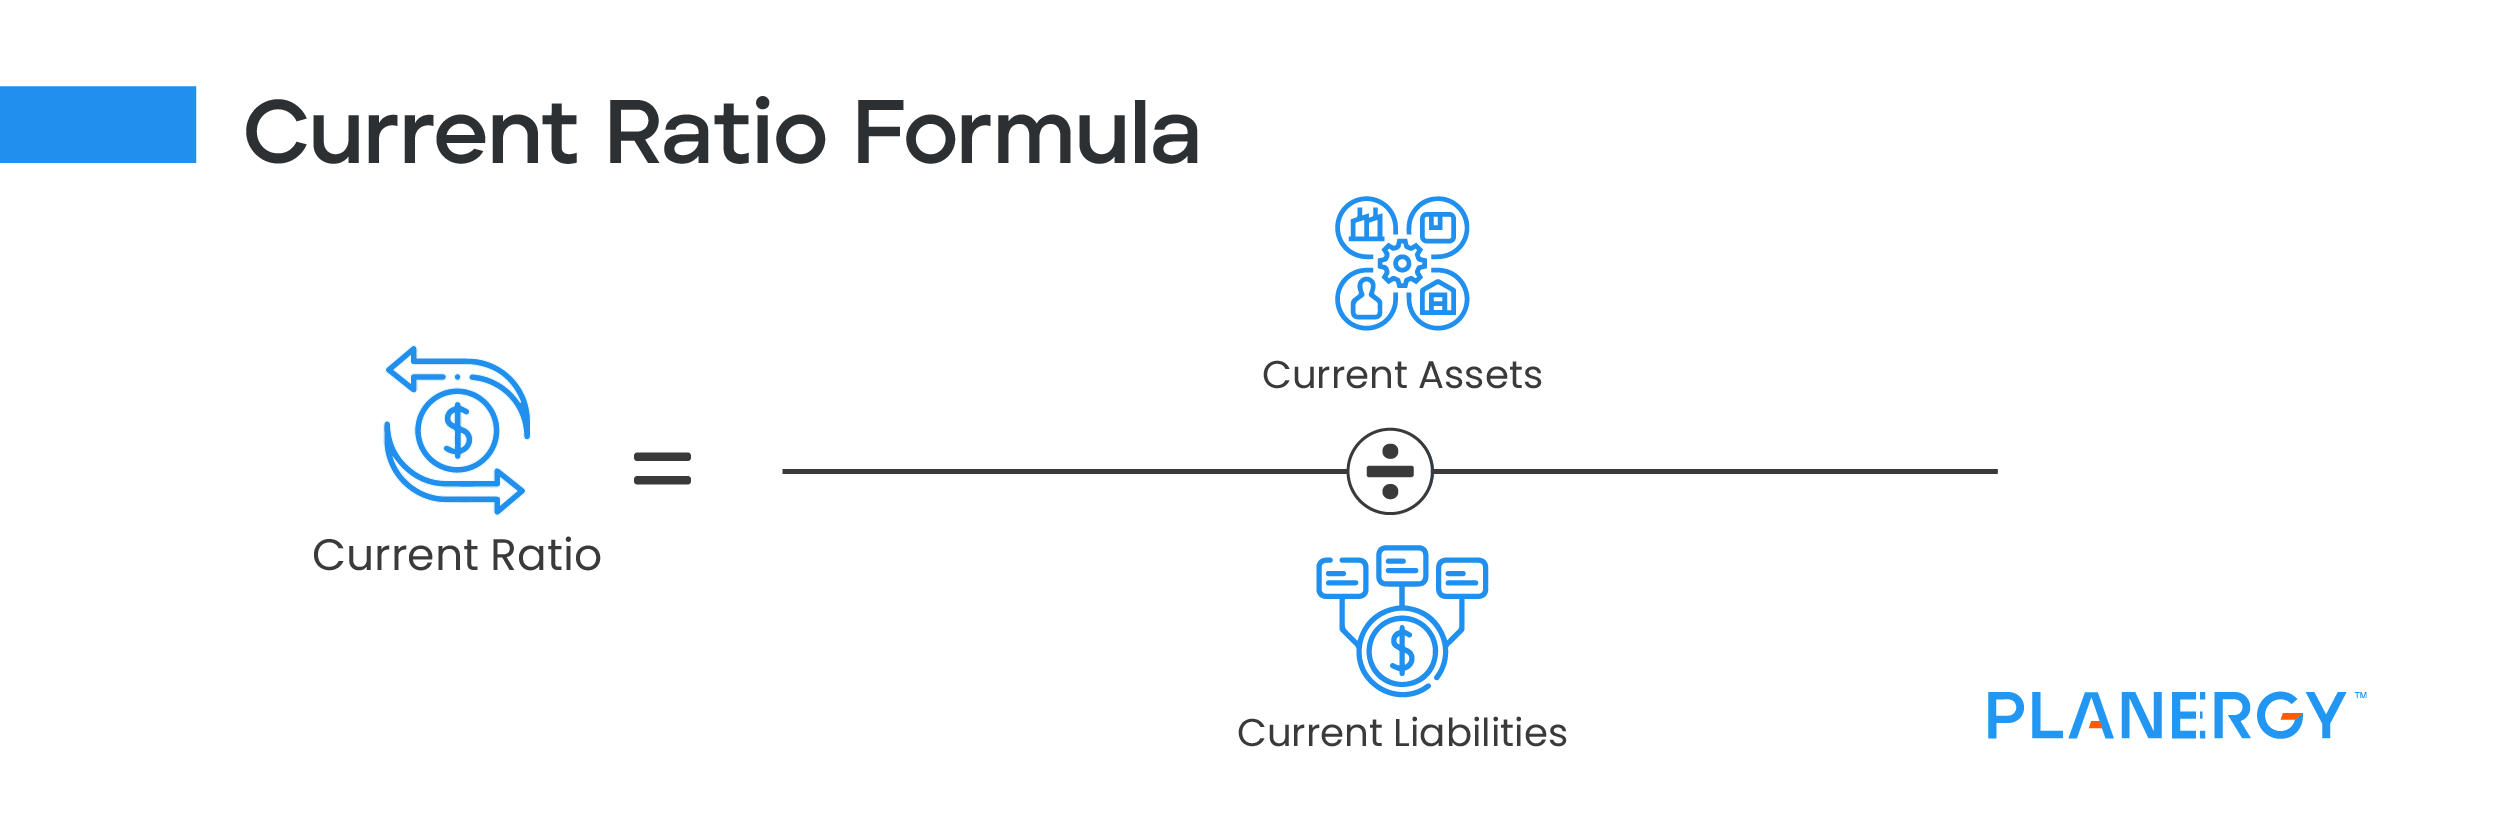
Current Ratio
Similar to the quick ratio, the current ratio is a liquidity ratio used to determine how well you’re in position to pay off debt, including interest expense.
First, obtain your asset and liability totals from your balance sheet.
Current Ratio = Current Assets / Current Liabilities
Using the same totals used in the quick ratio, minus inventory, here’s how you would calculate the current ratio:
$7,500,000 / $1,750,000 = 4.28
This means that for every dollar of liabilities, your business has $4.28 in assets. Again, a one-to-one result is necessary, and like the quick ratio, too high of a current ratio can indicate that you’re not using your assets aggressively enough.
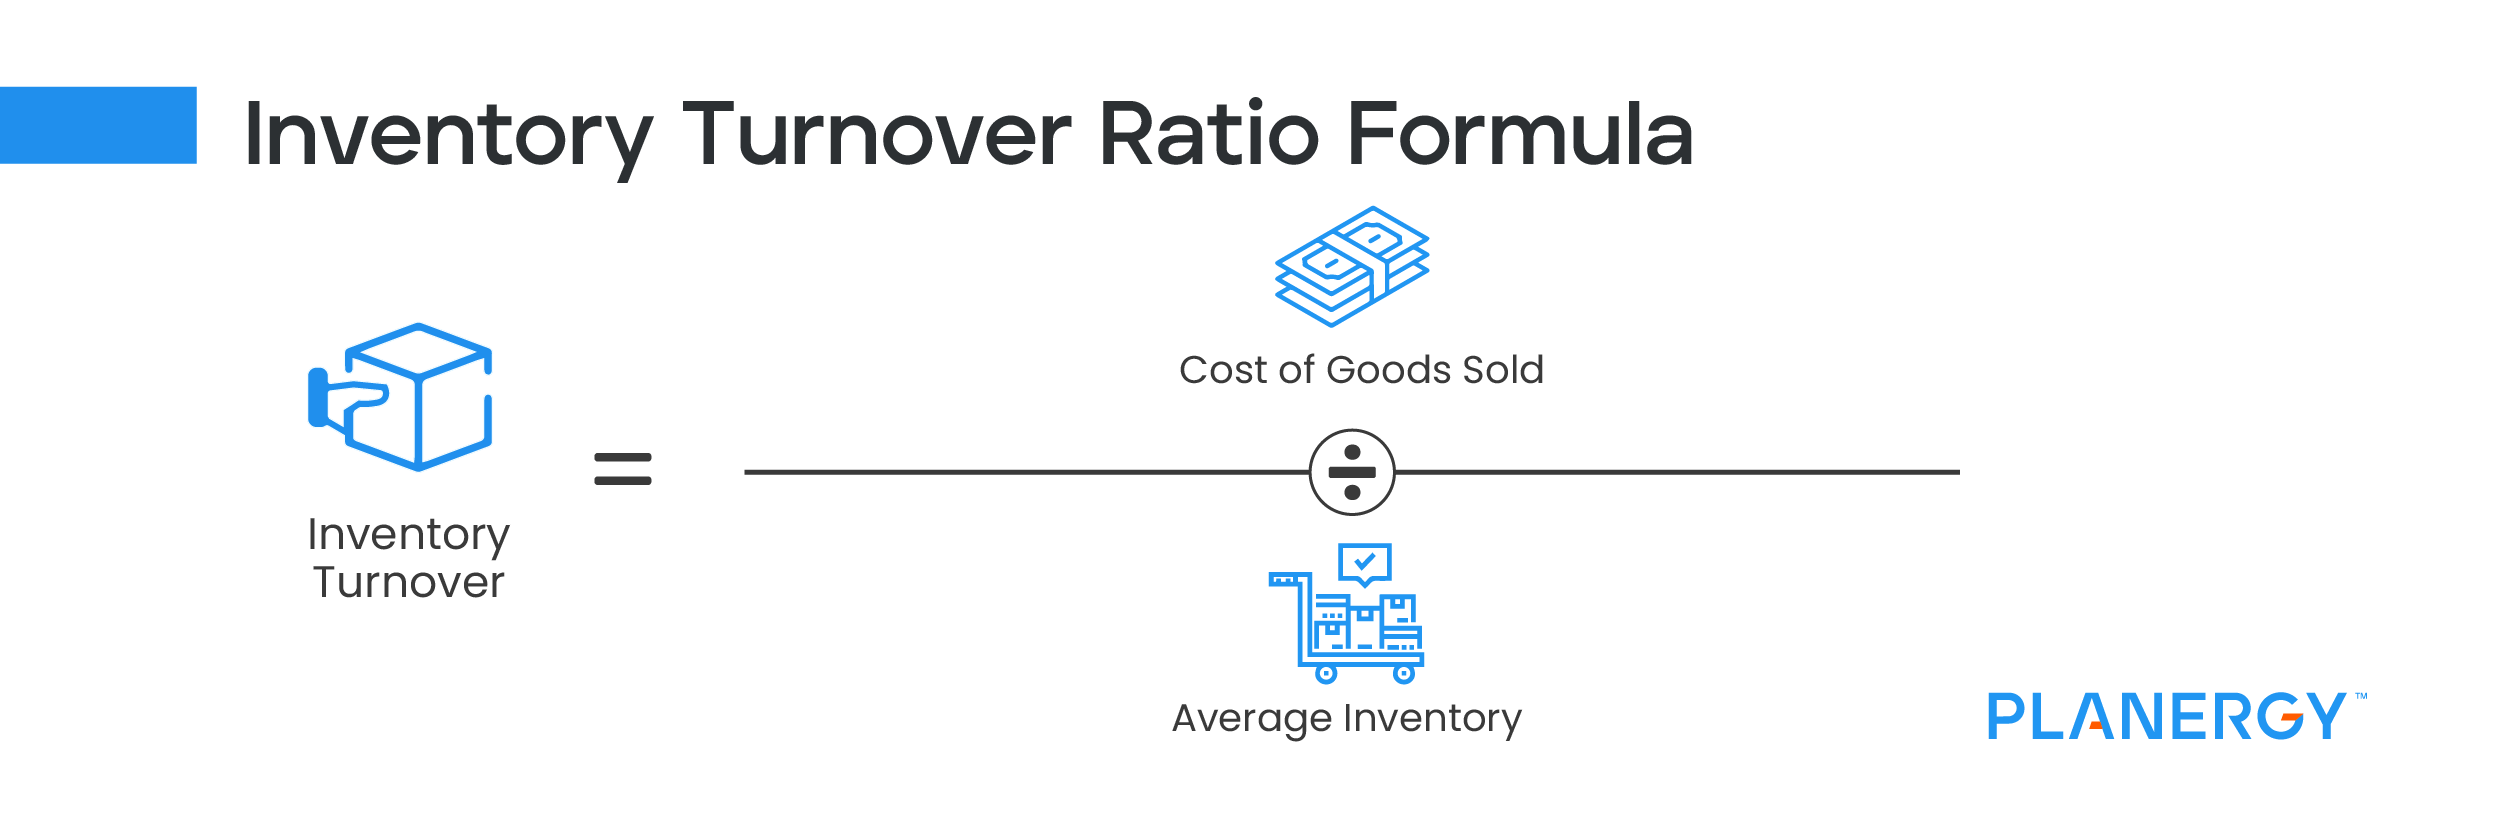
Inventory Turnover Ratio
If you don’t carry inventory, you can skip this ratio, but for those that do, calculating the inventory turnover ratio, an activity ratio, can provide good insight into how quickly your inventory moves.
You’ll need to track down a few numbers before calculating this ratio, including both beginning and ending inventory values for the period you’re calculating.
Inventory Turnover Ratio = Cost of Goods Sold / Average Inventory
For example, if your beginning inventory was $1,600,000 and your ending inventory was $1,800,000, your average inventory for the year would be $1,700,000. Then find your cost of goods sold on your income statement, which for this calculation is $6,500,000 to calculate the inventory turnover ratio.
$6,500,000 / $1,700,000 = 3.82
This result means that you sell your inventory almost 4 times annually. A good turnover ratio runs between 5% and 10%, with anything lower indicative of slow sales or an excessive amount of inventory on hand.
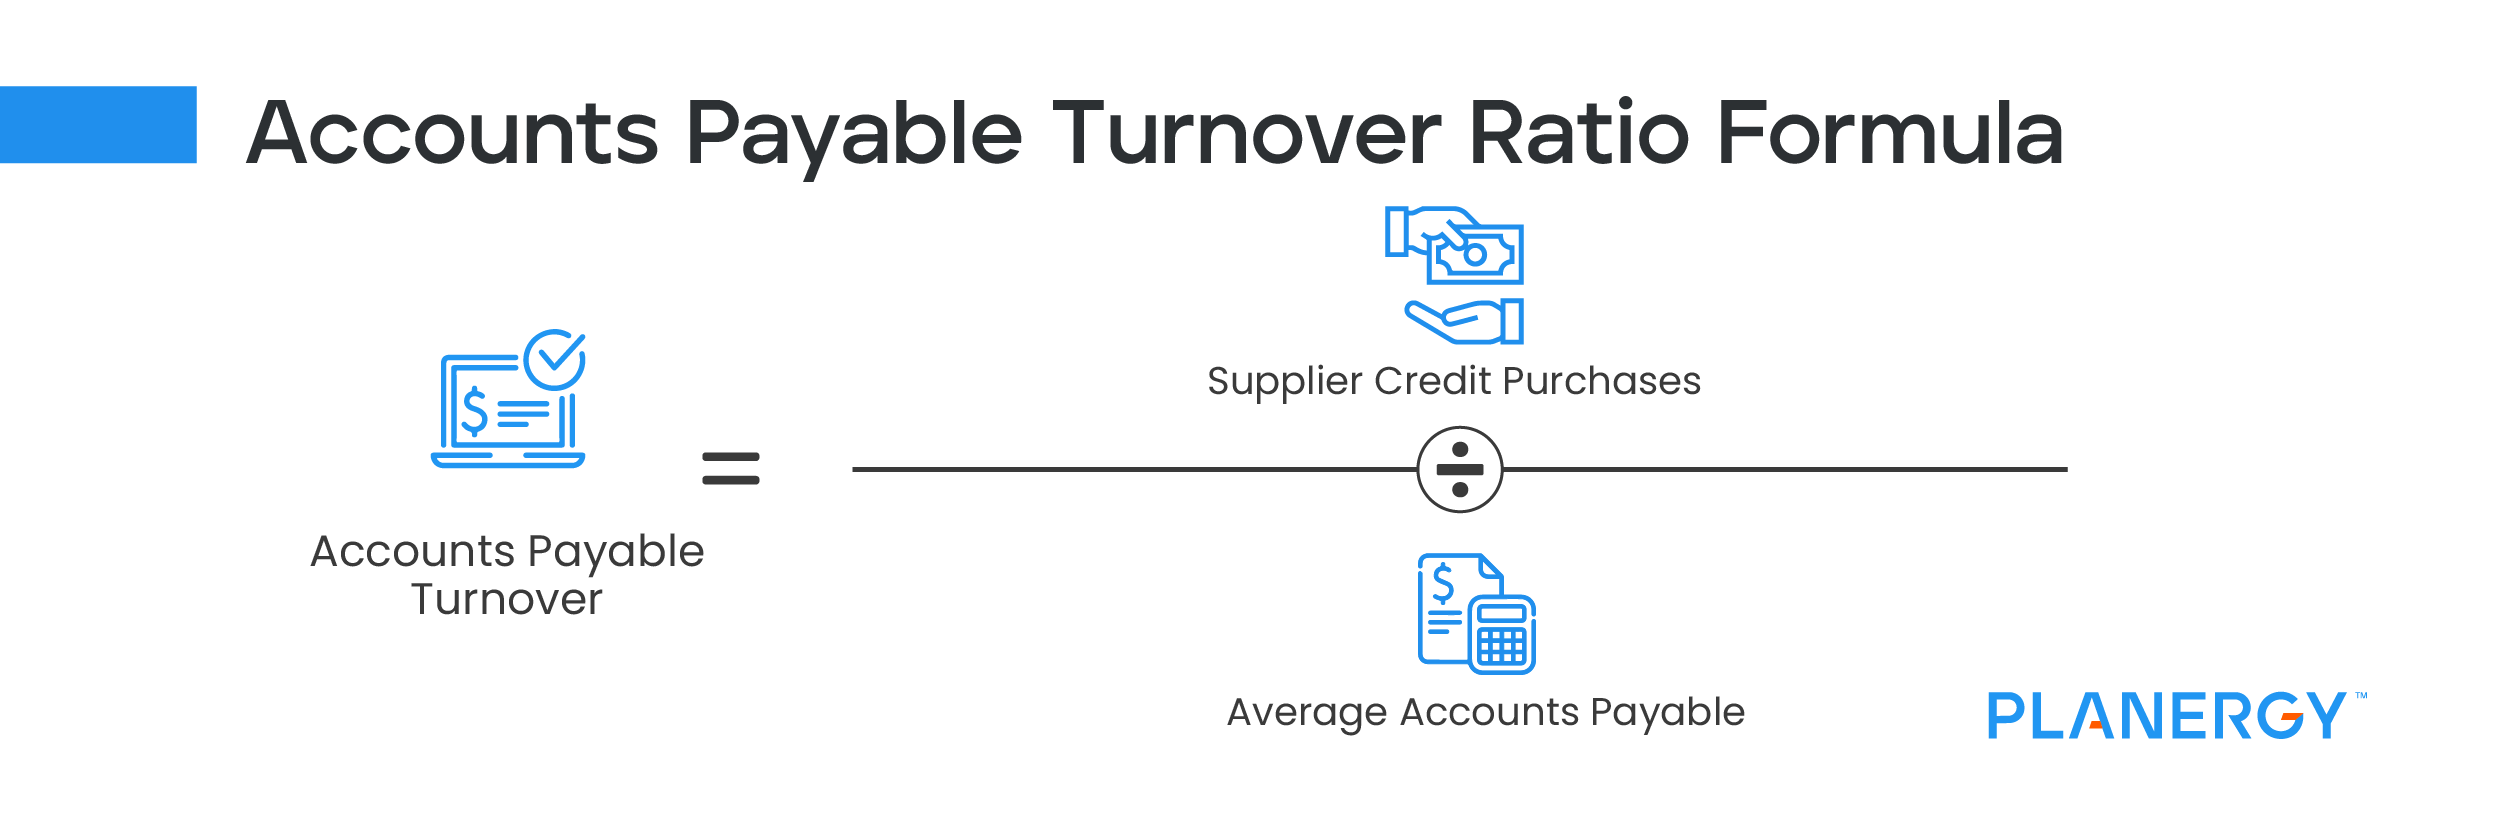
Accounts Payable Turnover Ratio
The accounts payable turnover ratio, a liquidity ratio, is used to determine a company’s ability to pay vendors and suppliers during a specific period. Used to help determine a company’s creditworthiness, the accounts payable turnover ratio needs to be calculated on a regular basis for it to be helpful.
The accounts payable turnover ratio requires several steps for calculation. First, you’ll have to calculate your average payables balance for the period. Next, you’ll need to calculate your net purchases. Once you have these two totals, you can calculate your AP turnover ratio.
Accounts Payable Turnover Ratio = Supplier Credit Purchases / Average Accounts Payable
Let’s say you have a beginning AP balance of $95,000 and an ending AP balance of $93,000, and total purchases of $425,000 with returns of $15,000. Your calculations would be as follows:
($95,000 + $93,000) / 2 = $94,000
$425,000 – $15,000 = $410,000
Now, you can calculate the ratio:
$410,000 / $94,000 = 4.36
This means that in 2021, your business paid your accounts payable balances 4.36 times throughout the year.
With the accounts payable turnover ratio, a higher number is usually better, since a higher number means you’re paying your AP balances more frequently, though too high of a number can also mean that credit circumstances are forcing you to pay your bills early.
If your AP turnover ratio is consistently low, you may want to consider using a procure-to-pay software like PLANERGY, that can streamline the entire AP process from purchase order to invoice payment.
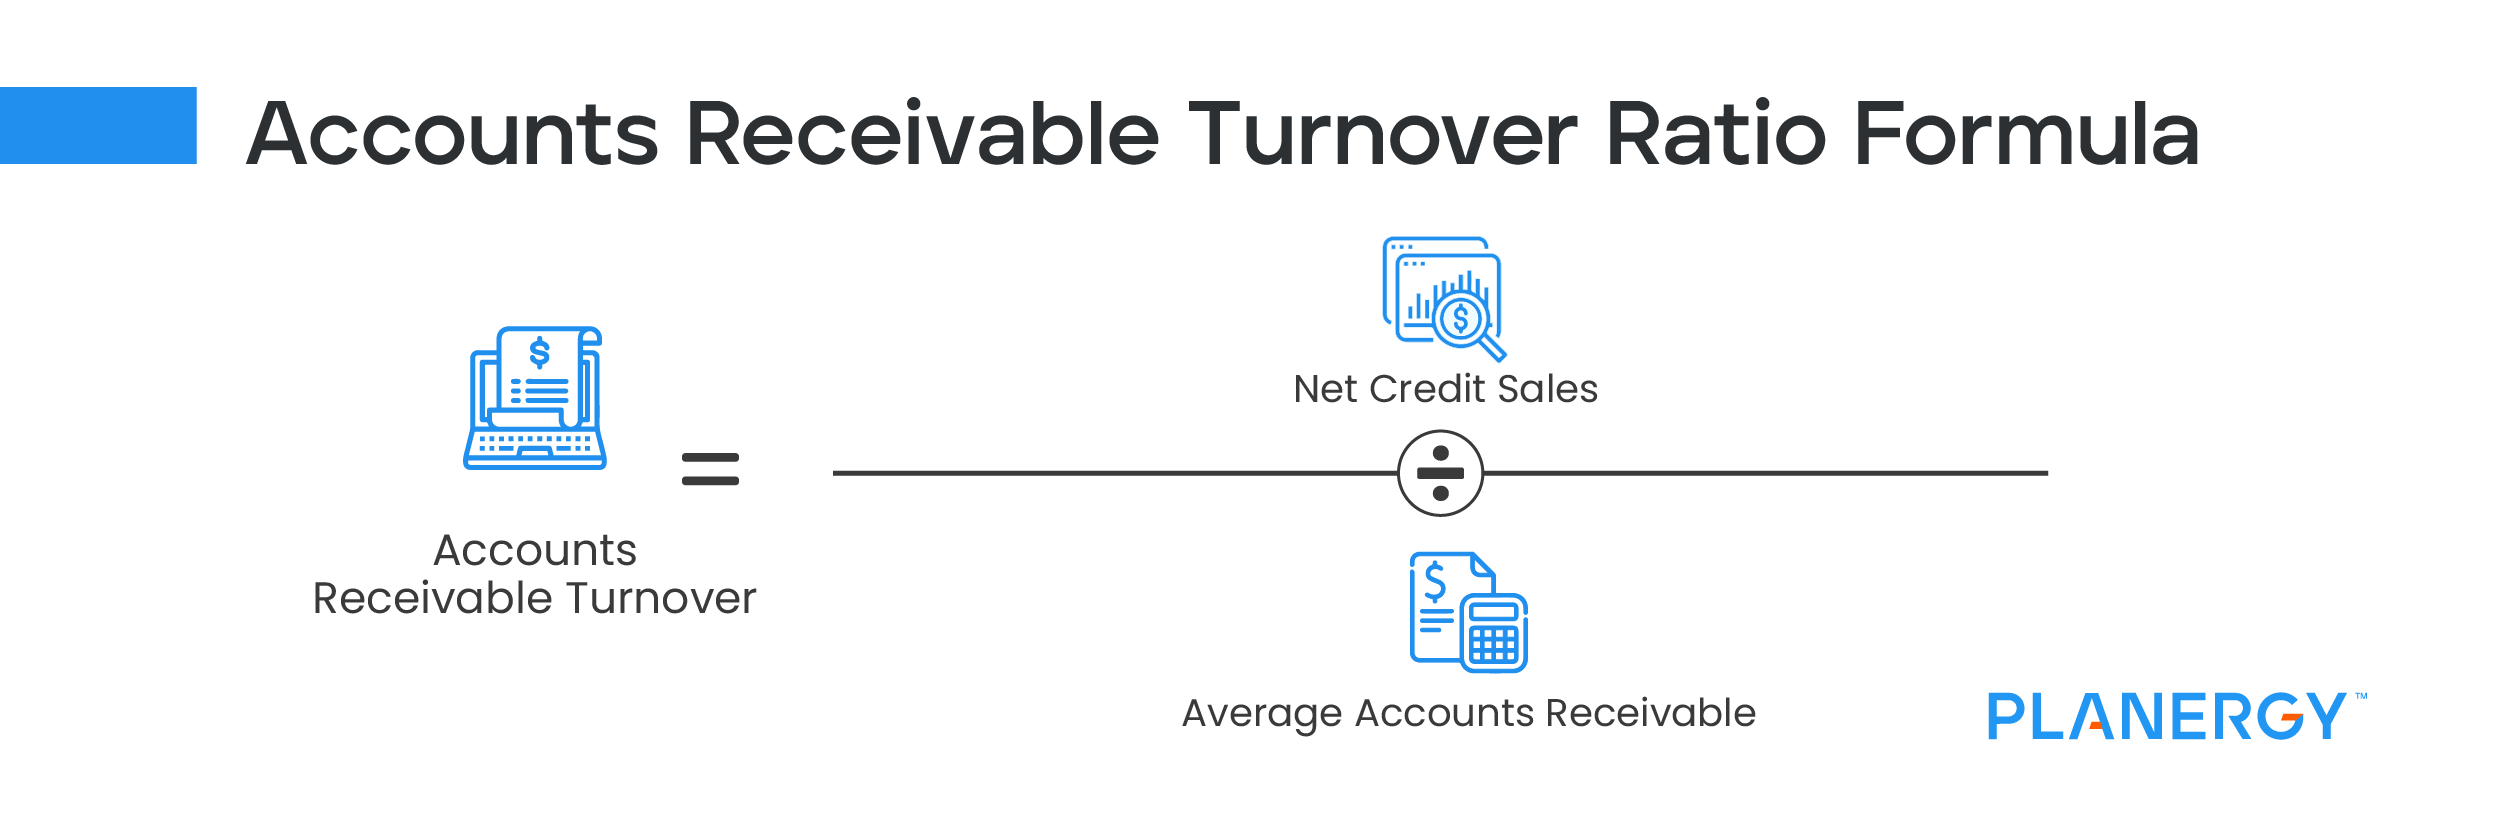
Accounts Receivable Turnover Ratio
Like the accounts payable turnover ratio, the accounts receivable turnover ratio should be calculated regularly. This activity ratio measures how quickly you’re collecting outstanding balances from your credit customers.
To calculate your AR turnover ratio, you’ll need to obtain your total credit sales for the time period in question, excluding cash sales in your total.
You’ll then need to obtain your beginning and ending accounts receivable balances for that same period.
Accounts Receivable Turnover Ratio = Net Credit Sales / Average Accounts Receivable
Let’s say for 2021, your business had total sales in the amount of $1,200,000, with $10,000 of that cash sales. Next, your beginning AR balance as of January 1 is $474,000 with an ending balance as of December 31 of $470,000. These are your calculations:
$1,200,000 – $10,000 = $1,190,000
$274,000 + $270,000 / 2 = $272,000
With this information, you can calculate your AR turnover ratio:
$1,190,000 / $272,000 = 4.37
This indicates that you collect your AR balances around four times a year.
The higher your accounts receivable turnover ratio, the quicker you’re getting paid by your credit customers. Of course, too high of a number can also indicate that you’re only offering limited credit terms to your very best customers.
Debt-to-Equity Ratio
Also known as a debt-to-asset ratio, the debt-to-equity ratio is a leverage ratio that looks at your current level of debt compared to your total assets to determine financial leverage.
This debt ratio is used to help determine how much of your assets are financed from loans compared to owner equity. The debt-to-equity ratio is popular with those looking to invest in a company since it tells them how well a company can cover its current amount of debt.
You can calculate this ratio by obtaining total liabilities and total shareholder’s equity, with both numbers found on your balance sheet.
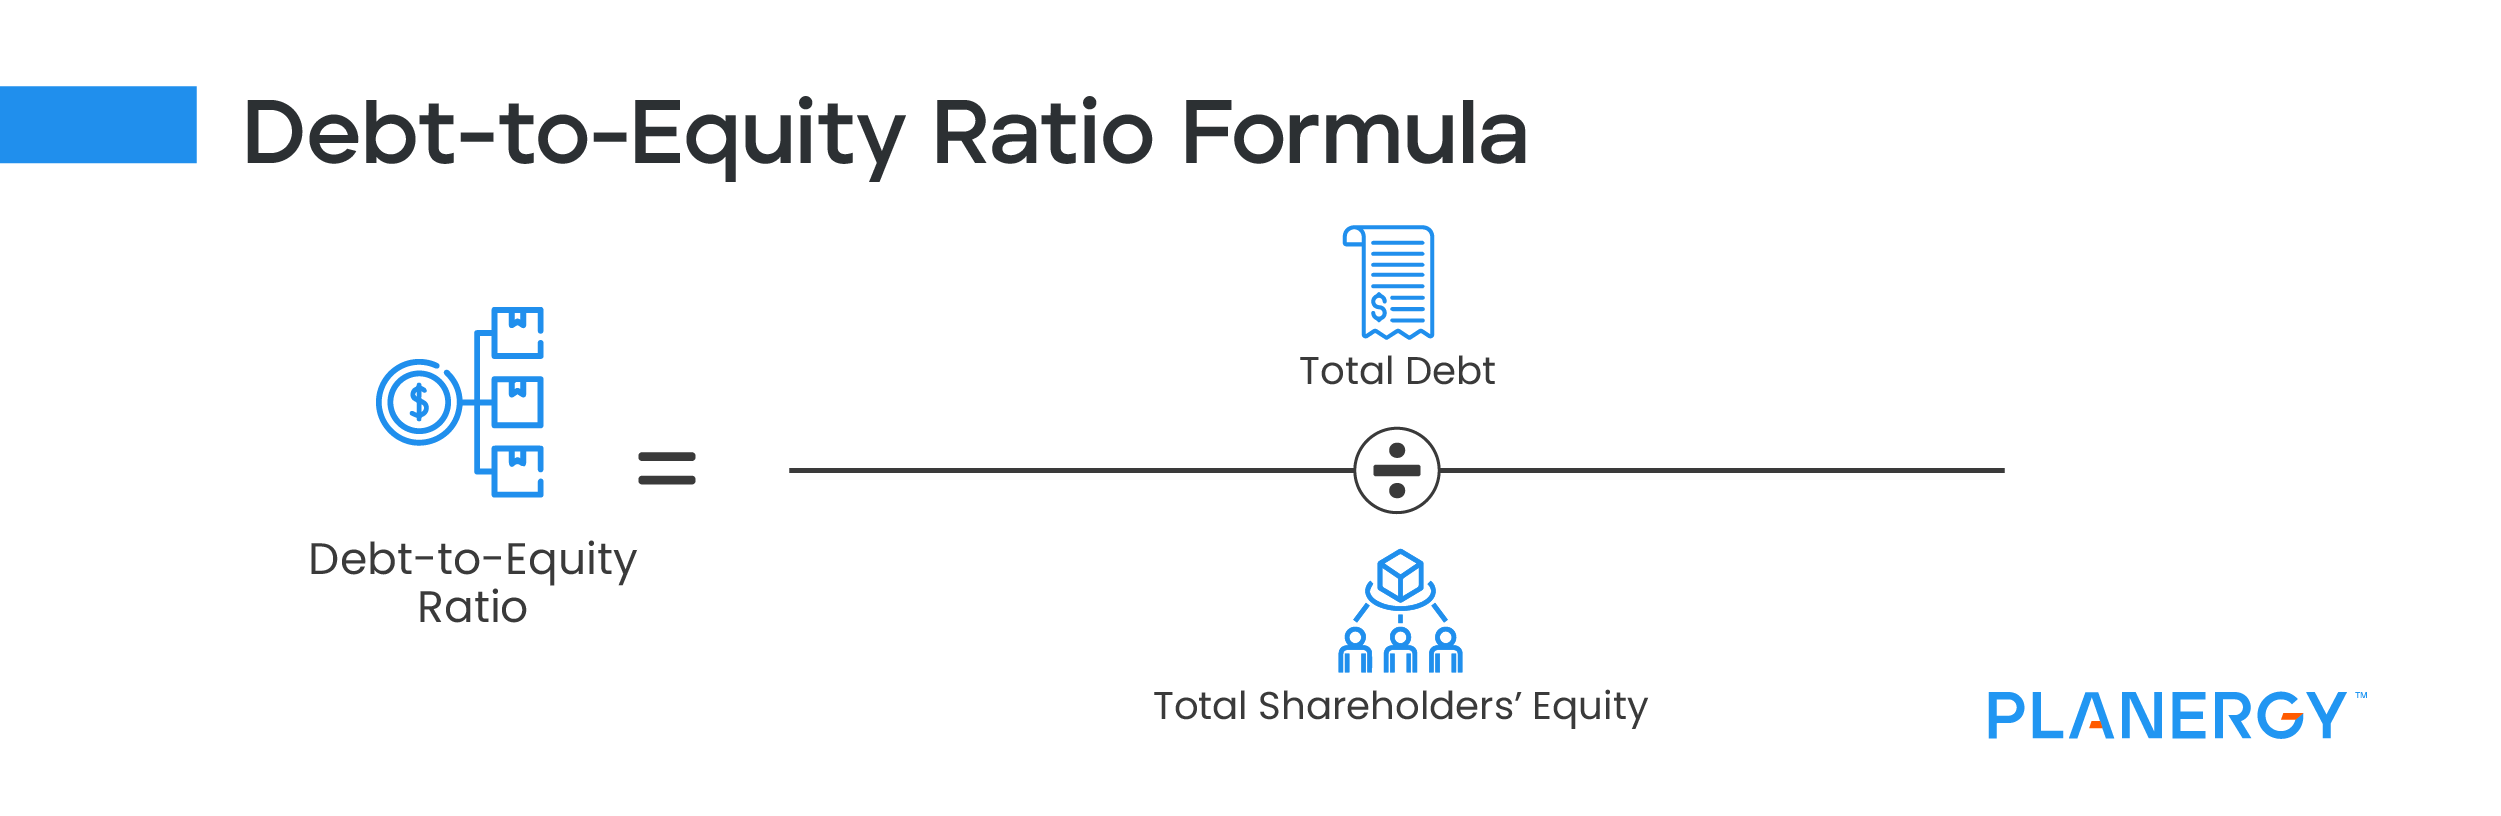
Debt-to-Equity Ratio = Total Debt / Total Shareholders’ Equity
For example, if your business currently has total liabilities of $1,400,000 and total shareholder’s equity of $ 2,100,000 you would calculate the debt-to-equity ratio as follows:
$1,400,000 / $2,100,000 = 067
This result means that for every dollar of equity your business has, it currently has $0.67 in debt. Though a good debt-to-equity ratio can vary from industry to industry, anything less than 1 is considered good, while a debt-to-equity ratio higher than 2 signals that your company is highly leveraged and a riskier investment.
How to Use Accounting Ratios in Your Business
Accounting or financial ratios can be extremely useful for businesses, provided that the proper ratio analysis is completed. A ratio calculated only once provides a good snapshot into your business finances but provides little in the way of useful detail if they’re not calculated regularly.
1. Use PLANERGY to manage purchasing and accounts payable
We’ve helped save billions of dollars for our clients through better spend management, process automation in purchasing and finance, and reducing financial risks. To discover how we can help grow your business:
Visit our Accounts Payable Automation Software page to see how PLANERGY can automate your AP process reducing you the hours of manual processing, stoping erroneous payments, and driving value across your organization.
2. Download our guide “Preparing Your AP Department For The Future”
Download a free copy of our guide to future proofing your accounts payable department. You’ll also be subscribed to our email newsletter and notified about new articles or if have something interesting to share.
3. Learn best practices for purchasing, finance, and more
Browse hundreds of articles, containing an amazing number of useful tools, techniques, and best practices. Many readers tell us they would have paid consultants for the advice in these articles.
We use cookies to personalise content and ads, to provide social media features and to analyse our traffic. We also share information about your use of our site with our social media, advertising and analytics partners who may combine it with other information that you’ve provided to them or that they’ve collected from your use of their services.
The technical storage or access is strictly necessary for the legitimate purpose of enabling the use of a specific service explicitly requested by the subscriber or user, or for the sole purpose of carrying out the transmission of a communication over an electronic communications network.
Preferences
The technical storage or access is necessary for the legitimate purpose of storing preferences that are not requested by the subscriber or user.
Statistics
The technical storage or access that is used exclusively for statistical purposes.The technical storage or access that is used exclusively for anonymous statistical purposes. Without a subpoena, voluntary compliance on the part of your Internet Service Provider, or additional records from a third party, information stored or retrieved for this purpose alone cannot usually be used to identify you.
Marketing
The technical storage or access is required to create user profiles to send advertising, or to track the user on a website or across several websites for similar marketing purposes.
")
")
")
