
Every business aims to be solvent, which means having enough assets on hand to cover any current liabilities.
But being solvent also means that a company is also able to meet long-term debts and financial obligations as well.
In many instances, solvency can be determined by simply analyzing the information found on your financial statements.
However, for business owners who wish to assess solvency over the long term, solvency ratios can be helpful.
While useful internally, solvency ratios are also useful for lenders and investors who need to assess a company’s long-term financial health.
What is a Solvency Ratio?
Solvency ratios are an easy way to measure the long-term profitability of your business.
A useful tool for businesses of any size, solvency ratios look at how efficiently your business can pay off its debts along with its ability to cover long-term debt obligations, all while generating sufficient cash flow.
There are several solvency ratios that can be calculated, depending on the information you’re looking for.
Types of Solvency Ratios and How They’re Calculated
The following four solvency ratios are used most frequently by businesses and investors alike.
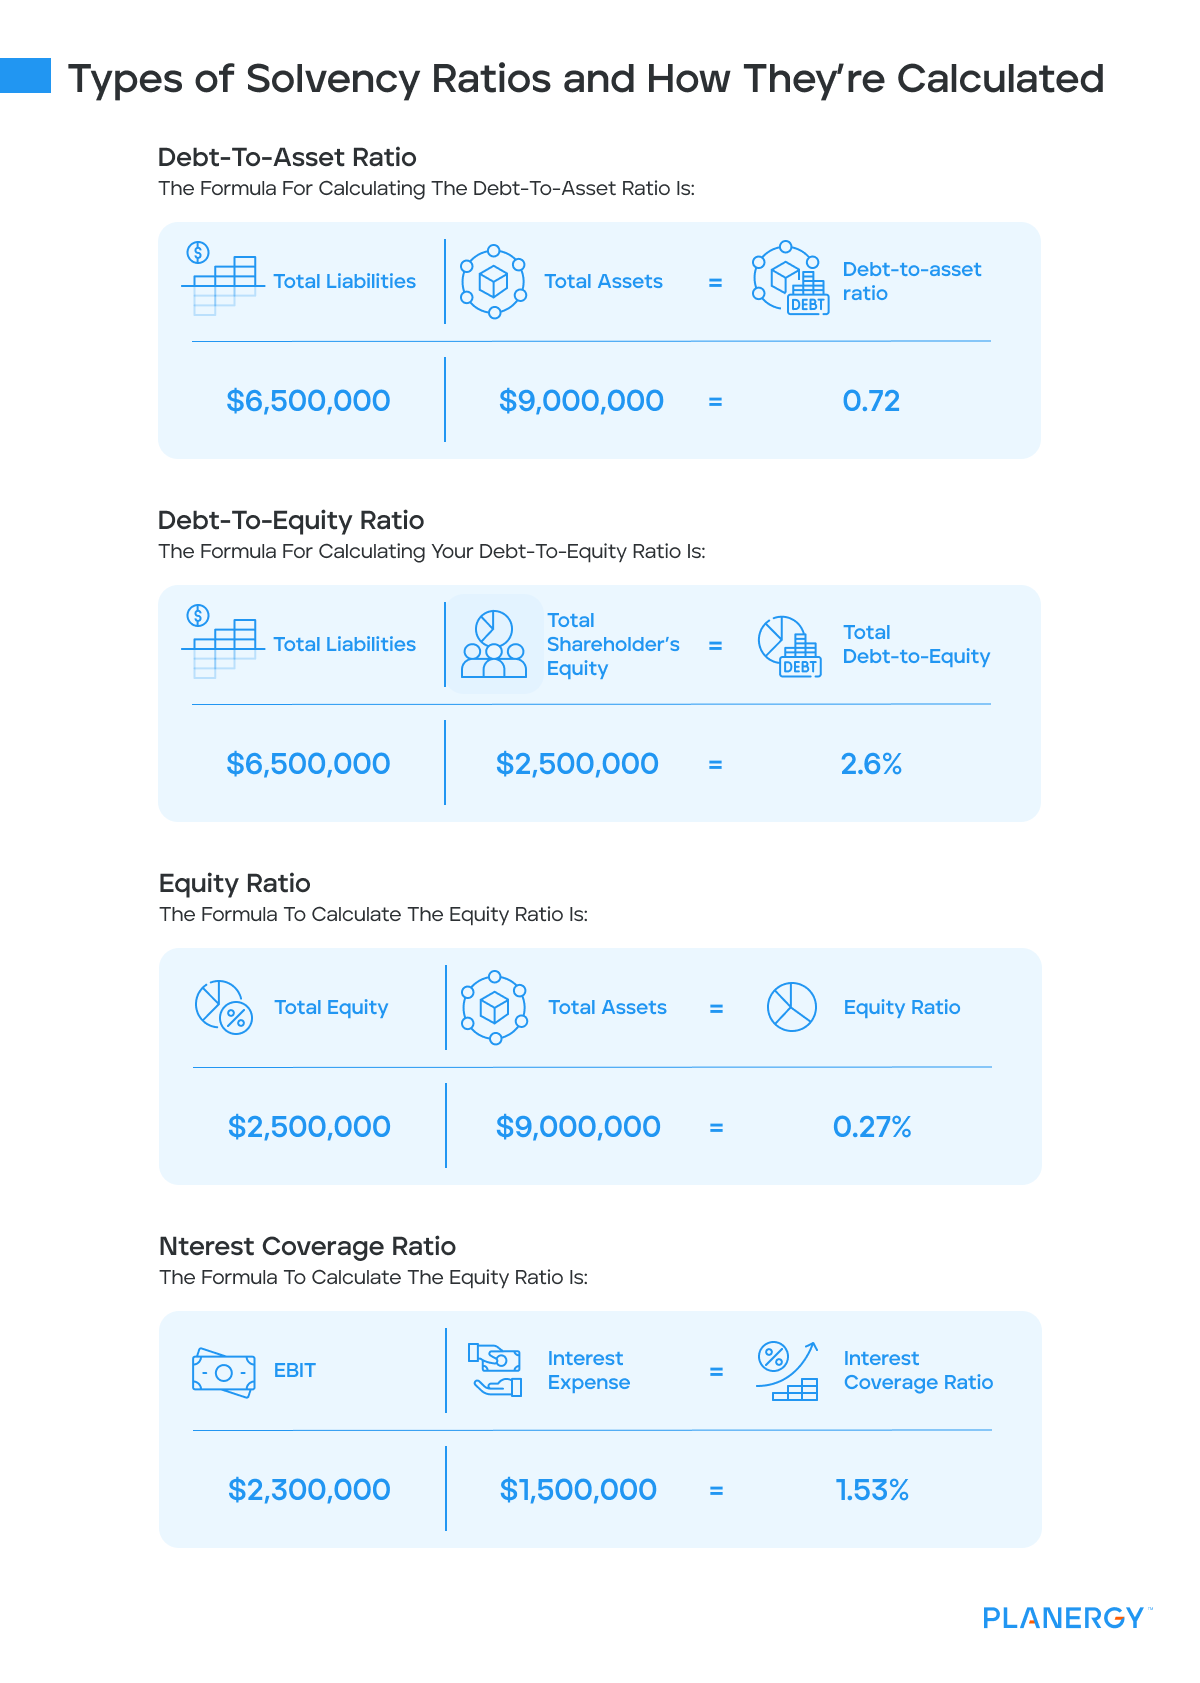
Debt-to-Asset Ratio
Perhaps the most frequently used of all the solvency ratios, the debt-to-asset ratio measures the percentage of assets that are currently financed by both short-term and long-term liabilities.
Companies that have a higher debt-to-asset ratio are considered highly leveraged, while a lower debt-to-asset ratio indicates stability.
The formula for calculating the debt-to-asset ratio is:
Total Liabilities / Total Assets = Debt-to-asset ratio
For example, for the 2023 fiscal year, AAA Manufacturing reported total assets of $9 million and total liabilities of $6.5 million on their balance sheet.
Let’s calculate their debt-to-asset ratio.
$6,500,000 / $9,000,000= 0.72
This result indicates that 72% of the company’s assets are currently funded by debt, making the company over-leveraged in the eyes of many investors.
Debt-to-Equity Ratio
The debt-to-equity ratio measures outstanding debt against total equity.
This ratio is important for companies looking to take on additional debt, as it allows them to determine the amount of debt financed in comparison to total equity.
The formula for calculating your debt-to-equity ratio is:
Total Liabilities / Total Shareholder’s Equity = Total Debt-to-Equity
Continuing with AAA Manufacturing, using the accounting equation, we know that with $9 million in assets and $6.5 million in debt, AAA Manufacturing’s current equity is $2.5 million.
Using those figures, we’ll calculate total debt-to-equity.
$6,500,000 / $2,500,000 = 2.6%
This means that for every dollar of equity AAA Manufacturing has on the books, it has almost $3 in debt.
Most investors and creditors prefer that the total debt-to-equity ratio be 1 or less, depending on the industry you’re in.
Equity Ratio
For businesses that commonly finance assets with debt, there’s always the concern that your company could become overleveraged, making it more at risk for failure.
If you want to know how much debt your business has compared to assets, you can calculate the equity ratio.
The formula to calculate the equity ratio is:
Total Equity / Total Assets = Equity Ratio
Let’s use AAA Manufacturing’s numbers to calculate their equity ratio.
$2,500,000 / $9,000,000 = 0.27%
This means that investors are currently funding only 27% of the company’s assets, with creditors funding the rest, leaving the business highly leveraged.
Interest Coverage Ratio
The interest coverage ratio is designed to look at one specific portion of your business: how well you can cover interest expense on your current debt.
Calculating the interest coverage ratio requires you to first obtain your current operating earnings, or EBIT, which is earnings before interest and income taxes from your current income statement.
The formula to calculate the interest cover ratio is:
EBIT / Interest Expense – Interest Coverage Ratio
Let’s say that AAA Manufacturing has an EBIT of $2.3 million with current interest expenses of $1.5 million.
$2,300,000 / $1,500,000 = 1.53%
Generally speaking, the interest coverage ratio should be at least 2, which would indicate that it had twice as much earnings as interest expense, making the company less of a risk.
What Do the Solvency Ratio Results Mean?
Solvency ratios are just one group of financial ratios that can help you keep your business financially sustainable.
When used with other ratios, such as liquidity ratios or profitability ratios, you can garner a much clearer picture of your business.
Let’s examine each one of the solvency ratios we’ve calculated for AAA Manufacturing to determine what those results mean and how business owners can use that information to improve their financial health.
For example, AAA Manufacturing had $9 million in assets at the end of fiscal year 2023 along with total liabilities of $6.5 million.
When we take a closer look at their debt-to-asset ratio, the results come in high at 0.72, which means that almost three-quarters of their assets are funded by debt instead of investor equity.
This can raise a red flag for investors and financial institutions as a debt-to-asset ratio of less than .50 is preferred, with a higher ratio indicating potential business instability.
Next, we’ll look at AAA Manufacturing’s debt-to-equity ratio, which measures total equity against outstanding debt.
Though this result can vary from industry to industry, in general, a debt-to-equity ratio of less than 1 is preferred, with a 2 considered a red flag.
In our calculation, AAA Manufacturing’s ratio result is 2.6, meaning that right now, AAA Manufacturing has nearly $3 in company debt for every dollar of equity, putting them in the danger zone for investors and financial institutions alike.
The next step in analyzing AAA Manufacturing is looking at its equity ratio results.
Right now, AAA Manufacturing’s equity ratio is 0.27%, which indicates that their financial leverage is high, making them a greater financial risk.
In most cases, it’s best to have an equity ratio of 50%, which indicates that at least half of the company’s assets are funded by equity.
The final solvency ratio we ran for AAA Manufacturing was the interest coverage ratio. Not every business will need to run this ratio, only those that have a high level of interest payments.
We’ll start with the company’s EBIT, which was $2.3 million, with interest payments totaling $1.5 million, leaving them with an interest coverage ratio of 1.53%.
Though industry preference is 2 or higher, AAA Manufacturing’s results mean that they can pay their interest payments one and a half times.
Only if their interest coverage ratio drops below 1 would investors and financial institutions have cause for concern.
Remember that while solvency ratio results can certainly help you assess current and future solvency, they’re best used with other financial ratios to provide a more complete view of your business.
Is a High Solvency Ratio Good?
In most cases, a high solvency rate is better than a low rate.
A higher rate indicates a better probability that a business will be able to pay off its debts, both now and in the future.
On the other hand, a low solvency rate often indicates a company that is highly leveraged and a riskier investment.
However, there are instances when a high solvency rate is indicative of missed growth opportunities through investments.
That’s why it’s important to compare your solvency ratio results against businesses in a similar industry.
How Do Solvency Ratios Vary Between Industries?
Some industries such as telecommunications, must make significant investments in infrastructure before they can offer a completed product to their customers.
The oil and gas industry also requires significant capital investments before their product is ready for use.
Because these companies carry a high level of debt, their debt-to-equity ratio is higher than normal industry standards.
In addition to industry, the size of a business may have relevance when comparing financial ratios, even within the same industry.
For example, a small gift shop would be better served to compare ratio results with similar small businesses rather than using Walmart or Target as a comparison.
Solvency Ratios vs. Liquidity Ratios
While liquidity refers to the current status of a business, solvency refers to the business being financially healthy in the long term.
Both solvency and liquidity are important for a business.
While solvency ratios are used to determine both current and long-term ability to meet financial obligations, liquidity ratios are used solely for determining a business’s capability to meet short-term financial obligations.
For example, a common liquidity ratio, the current ratio, looks at cash availability for short-term debt.
The current ratio formula is:
Current Assets / Current Liabilities = Current Ratio
The higher the current ratio, the more likely your business will be able to cover all of its short-term liabilities and other short-term obligations.
On the other hand, the debt-to-equity ratio looks at the total amount of debt a business is carrying against its total assets to determine long-term solvency.
Solvency Ratios vs. Profitability Ratios
A solvency ratio uses assets, liabilities, and equity totals to predict how solvent a business is now and in the future.
In turn profitability ratios are used to assess how well current business operations can produce a profit.
For example, a common profitability ratio, profit margin divides net profit by revenue to determine how much of each dollar earned is profit.
Let’s say that AAA Manufacturing’s net income for 2023 was $179,000 with revenue of $815,000. Let’s calculate their profit margin for 2023.
$179,000 / $815,000 = 0.22
This result means that for every dollar of revenue AAA Manufacturing received in 2023, $0.22 was profit.
Is Solvency the Same as Debt?
Solvency is not the same as debt, though the two terms are related.
Solvency is the ability of a business to meet its long-term financial obligations, while debt is the amount of money owed to an outside source.
There is a close relationship between the two since calculating solvency requires you to calculate current debt, but the two terms are not the same.
Increasing your debt load or paying off debt can have an immediate impact on your company’s solvency ratio, as can increasing your profit levels.
Why is Solvency Analysis Important?
Solvency ratios can help predict the financial health of a business, both currently, and in the future.
Solvency analysis can provide business owners, CFOs, and accountants with a window into their financial health, while also providing investors, potential investors, and lending institutions with the information they need to make more informed decisions.
In addition, solvency ratios can also help:
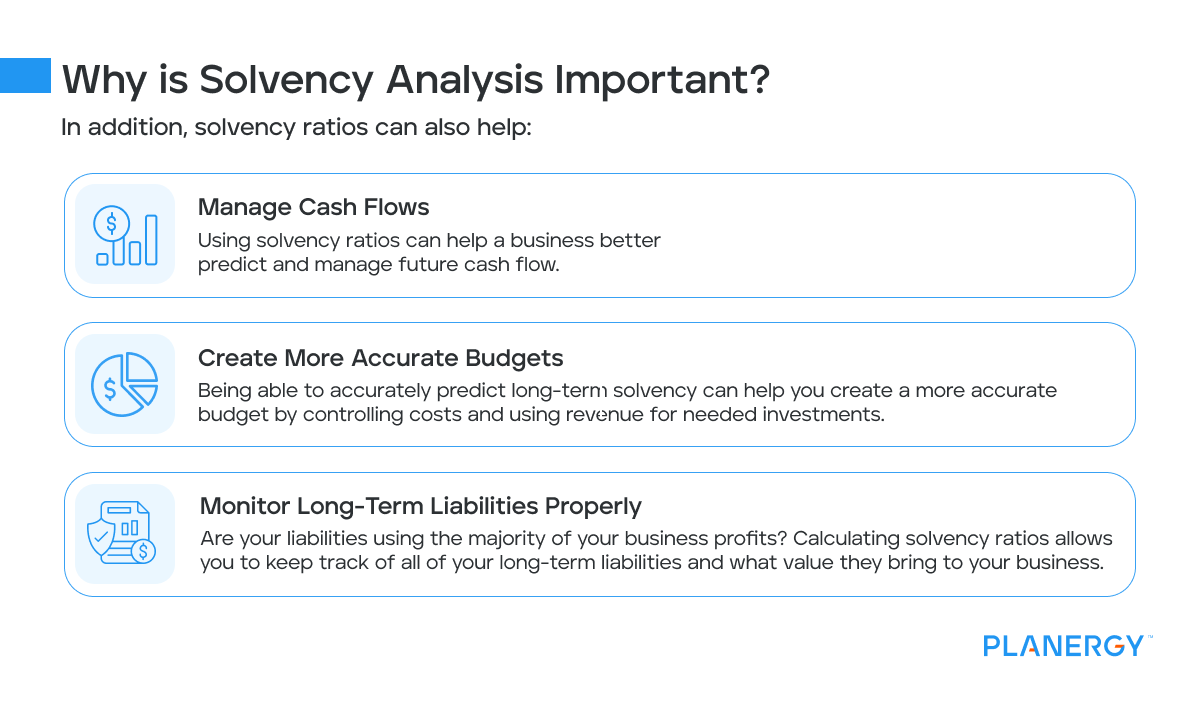
- Manage Cash Flows – Using solvency ratios can help a business better predict and manage future cash flow.
- Create More Accurate Budgets – Being able to accurately predict long-term solvency can help you create a more accurate budget by controlling costs and using revenue for needed investments.
- Monitor Long-Term Liabilities Properly – Are your liabilities using the majority of your business profits? Calculating solvency ratios allows you to keep track of all of your long-term liabilities and what value they bring to your business.
While solvency ratios play an important role in assessing a company’s ability to pay off debts, they should always be used with other financial metrics to offer a more complete view of the business as a whole.
How to Properly Use Solvency Ratios
To get the most out of any financial ratio, it’s best to do the following:
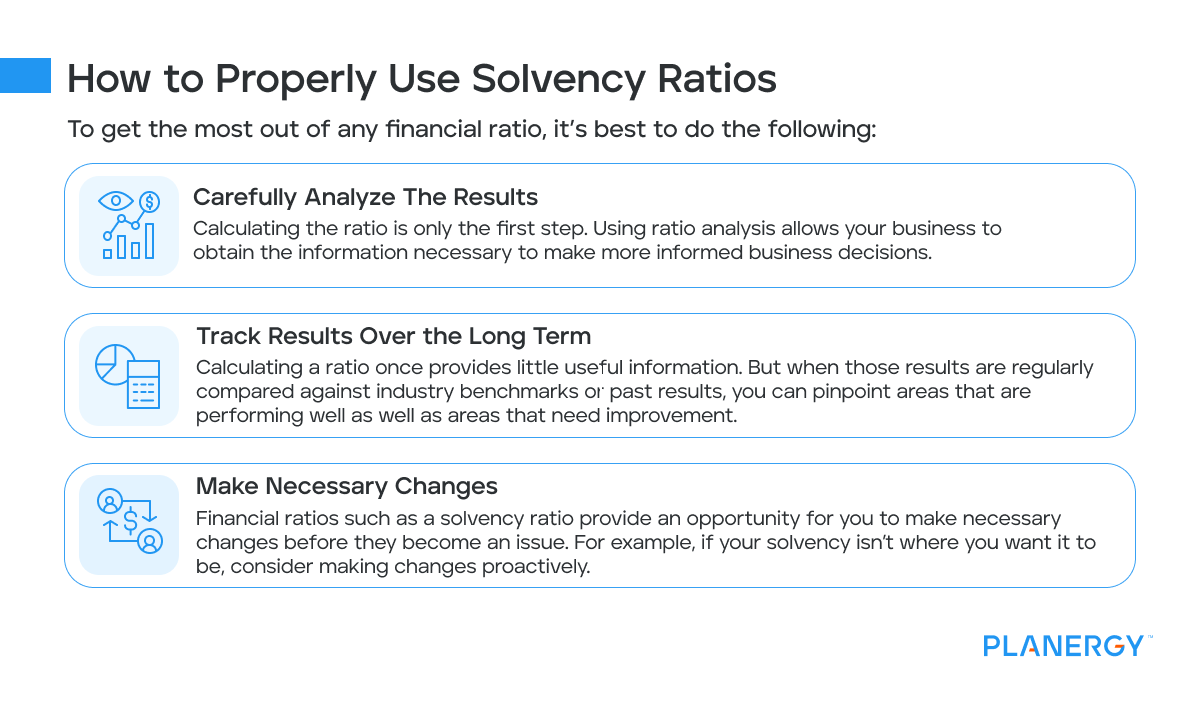
- Carefully Analyze The Results – Calculating the ratio is only the first step. Using ratio analysis allows your business to obtain the information necessary to make more informed business decisions.
- Track Results Over the Long Term – Calculating a ratio once provides little useful information. But when those results are regularly compared against industry benchmarks or past results, you can pinpoint areas that are performing well as well as areas that need improvement.
- Make Necessary Changes – Financial ratios such as a solvency ratio provide an opportunity for you to make necessary changes before they become an issue. For example, if your solvency isn’t where you want it to be, consider making changes proactively.
When financial analysis is completed using additional financial ratios such as the profit margin ratio or quick ratio, you’ll be better prepared to manage your company’s financial health while proactively dealing with financial issues before they lead to insolvency.
")
")
")
