Using KPIs and related metrics to better understand financial data is considered a best practice for any business, regardless of size.
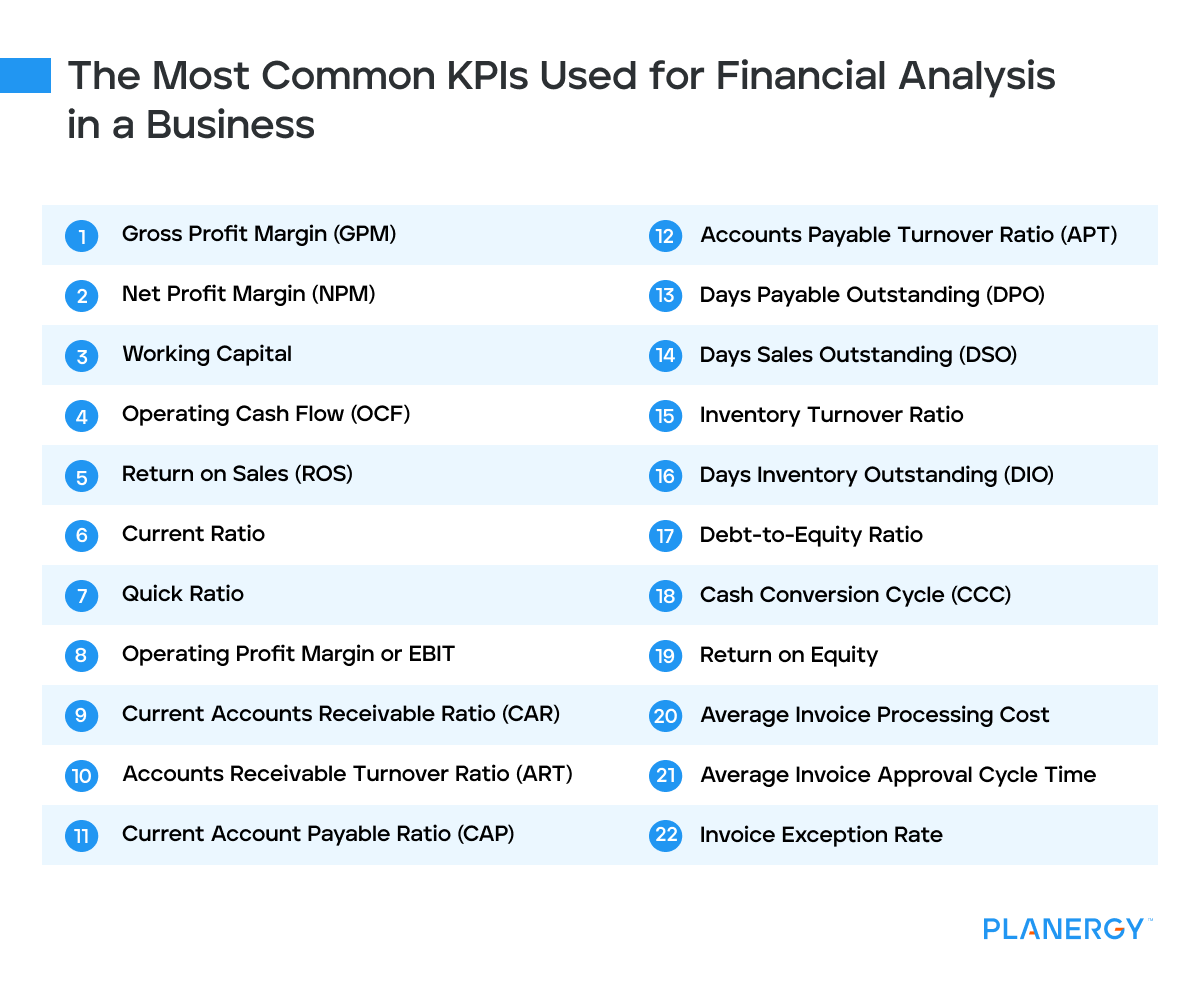
Below we’ve listed 22 of the most commonly used key performance indicators and financial metrics along with the formula for calculating them.
While you may not need to run all of them, consider which ones will work best for your business.
Gross Profit Margin (GPM)
Gross profit margin measures the profitability of your core business operations.
Gross profit margin looks at two areas; sales and cost of goods sold to determine how profitable operations are in any given period before subtracting other administrative costs.
The formula to calculate gross profit margin is:
(Net Sales – COGS) / Net Sales x 100% = Gross Profit Margin
Net Profit Margin (NPM)
Net profit margin calculates profitability after all associated business expenses have been subtracted.
Considered the ‘bottom line,’ when calculated along with gross profit, both ratios provide you with insights into total profitability.
For example, if your gross profit margin is high, but your net profit margin is low, that may indicate that you need to better manage operating expenses.
Net profit margin is calculated using the following formula:
(Net Income / Revenue) x 100% = Net Profit Margin
Working Capital
The working capital ratio looks at whether your current assets are enough to cover your current liabilities, with the calculation providing the total amount of cash available.
Current assets include cash, short-term investments, accounts receivable, and inventory, while current liabilities include accounts payable and short-term loans.
The formula to calculate working capital is:
Current Assets – Current Liabilities = Working Capital
Operating Cash Flow (OCF)
Similar to the working capital ratio, instead of measuring current assets, the operating cash flow ratio looks at current cash flow to determine whether your business has enough cash on hand to cover current liabilities.
You’ll need to use totals from your statement of cash flows to determine your operating cash flow ratio, with the formula:
Operating Cash Flow / Current Liabilities = Operating Cash Flow Ratio
Return on Sales (ROS)
The return on sales ratio calculates how much profit your company generates from each dollar of sales revenue received.
This is a great way to determine how efficiently your company turns total revenue into profit. The formula for calculating return on sales is:
(Earnings before Interest and Taxes / Net Sales) x 100% = Return on Sales
Current Ratio
The current ratio calculates the ratio between current assets and current liabilities.
Similar to the working capital metric which calculates the amount of working capital available, the current ratio looks at assets and liabilities side by side.
A ratio of less than one may indicate that a business does not have enough cash-based assets available to cover its liabilities.
The formula for calculating the current ratio is:
Current Assets / Current Liabilities = Current Ratio
Quick Ratio
The quick ratio, also known as the acid test ratio measures how quickly current assets can be converted into cash.
The quick ratio uses the total of all current assets minus inventory in its calculation and is used to determine your company’s ability to quickly generate cash to cover current liabilities.
The formula for the quick ratio is:
Quick Assets / Current Liabilities = Quick Ratio
Operating Profit Margin or EBIT
Operating profit margin or EBIT (Earnings Before Interest and Taxes) is used to measure overall profitability after all operating costs have been paid.
Tax liability and interest revenue are not included in the calculation.
The formula for calculating the operating profit margin is:
Operating Profit / Gross Revenue – Operating Profit Margin
Current Accounts Receivable Ratio (CAR)
The accounts receivable ratio looks at total sales to determine how many customers pay their invoices on time.
A higher result indicates that your company is collecting AR balances on time while a lower ratio indicates that there are problems collecting invoice payments.
The formula for calculating the current accounts receivable ratio is:
(Total Accounts Receivable – Past Due Accounts Receivable) / Total Accounts Receivable = Current Accounts Receivable Ratio
Accounts Receivable Turnover Ratio (ART)
The accounts receivable turnover ratio also looks at how quickly customers pay by determining how quickly your AR balance is converted to cash.
Though larger companies may calculate this ratio quarterly, ART is usually calculated annually.
The formula to calculate the accounts receivable turnover ratio is:
Sales / Average Accounts Receivable Balance = Accounts Receivable Turnover Ratio
Current Account Payable Ratio (CAP)
The current accounts payable ratio is used to determine whether a company is paying its bills on time.
A higher ratio indicates that bills are paid promptly while a lower result indicates payments are made late.
The formula for calculating the current accounts payable ratio is:
(Total Accounts Payable – Past Due Accounts Payable) / Total Accounts Payable = Current Accounts Payable Ratio
Accounts Payable Turnover Ratio (APT)
The accounts payable turnover ratio calculates how quickly you pay your vendors and suppliers by measuring how quickly your accounts payable account balance turns over throughout the year.
A higher ratio result indicates that you’re paying your bills quickly, while a lower one indicates that bills are not paid promptly.
Like the accounts receivable turnover ratio, this calculation is typically done annually. The formula to calculate your accounts payable turnover ratio is:
Net Credit Purchases / Average Accounts Payable Balance = Accounts Payable Turnover Ratio
Days Payable Outstanding (DPO)
This calculation offers another way to see how quickly you’re paying your bills. A lower days payable outstanding result indicates that you’re paying your bills quickly.
The formula to calculate days payable outstanding is:
(Accounts Payable x 365 Days) / COGS = Days Payable Outstanding
Days Sales Outstanding (DSO)
Days sales outstanding measures how quickly your customers pay their bills.
A lower days sales outstanding result indicates that your customers are paying you quickly.
The formula to calculate days sales outstanding is:
(Ending Accounts Receivable Balance / Gross Revenue) x 365 Days = Days Sales Outstanding
Inventory Turnover Ratio
If you’re selling products, the inventory turnover ratio is an important metric to calculate since it measures the average number of times during a specific period of time – typically a year, that your inventory is sold.
A higher number can indicate stronger sales while a lower one can indicate too much inventory on hand.
The formula to calculate the inventory turnover ratio is:
COGS / Average Inventory Balance = Inventory Turnover Ratio
Days Inventory Outstanding (DIO)
Days Inventory Outstanding can also be used to measure how quickly your business is able to sell its inventory, with the result measuring the average number of days it takes to sell an inventory item.
The formula to calculate DIO is:
(Average Inventory / COGS) x Number of Days = Days Inventory Outstanding
Debt-to-Equity Ratio
The debt-to-equity ratio measures the total debt your company is carrying compared to the amount of equity.
The calculation should include both short-term and long-term debt.
The formula to calculate the debt-to-equity ratio is:
Total liabilities / Total Equity = Debt-to-Equity Ratio
Cash Conversion Cycle (CCC)
The cash conversion cycle is used to calculate how long it takes a business to convert inventory into cash.
The CCC calculation uses the results of three other metrics; DIO, DSO, and DPO in its formula, which is:
Days Inventory Outstanding + Days Sales Outstanding – Days Payable Outstanding = Cash Conversion Cycle
Return on Equity
Return on equity shows how efficient a company is at managing investor capital.
The formula to calculate return on equity is:
Net Income / Shareholder Equity = Return on Equity
Average Invoice Processing Cost
An important metric to measure the efficiency of your accounts payable department processes, the average invoice processing cost is determined by adding the cost of the following:
- Labor
- Office supplies
- Accounting software
- Postage
Other costs such as time spent searching for a lost or misplaced invoice, voiding and reissuing an erroneous payment, or approval delays can also directly impact the total cost of processing an invoice.
A higher average cost usually indicates the need for AP automation.
Average Invoice Approval Cycle Time
While this metric measures the amount of time it takes to get an invoice approved, the results also directly impact other metrics such as the cost of processing an invoice.
The higher the invoice approval time, the higher your average invoice processing cost is likely to be.
Invoice Exception Rate
Your invoice exception rate directly impacts both your average invoice processing time and your average cost.
A high exception rate means more time spent processing an invoice and a higher processing cost.
When using KPIs, keep in mind that you’ll need to choose a suitable timeframe for calculating them.
While some KPIs and financial metrics should be calculated annually, larger businesses may find it more useful to run these metrics more frequently.


")

