
One of the most important tasks in financial accounting is accurate reporting.
But financial reporting alone doesn’t provide the information gained from completing financial statement analysis, which is essential for understanding the nuances of your company’s financial health.
Companies of different sizes all need assistance Identifying trends, researching variances, and correcting potential issues, all tasks that should be part of a complete financial statement analysis.
Two of the most common types of analysis are horizontal analysis and vertical analysis, with both offering clarity of the financial performance of a business by examining a company’s financial statements.
We’ll examine both horizontal and vertical analysis, what each method offers, the differences between them, and how to complete a horizontal and vertical analysis using your financial statements.
Used by internal stakeholders such as CPAs, CFOs, and controllers as well as by external stakeholders such as investors and lenders, each analysis technique is useful individually, but much more beneficial when used together.
What is Horizontal Analysis?
Horizontal analysis, also known as trend analysis is used for businesses that want to examine financial performance over a set period of time, typically a financial quarter, or year, though analysis can be completed monthly if desired.
Horizontal analysis is usually the go-to analysis used by CPAs and CFOs for companies that have been operating for a significant period of time.
Using horizontal analysis, you’re comparing results from one time period to another.
Horizontal analysis is particularly useful when looking to spot variances or pinpoint areas that have experienced significant change year-over-year to examine both current and past performance.
How to Perform Horizontal Analysis
Performing horizontal analysis follows three steps.
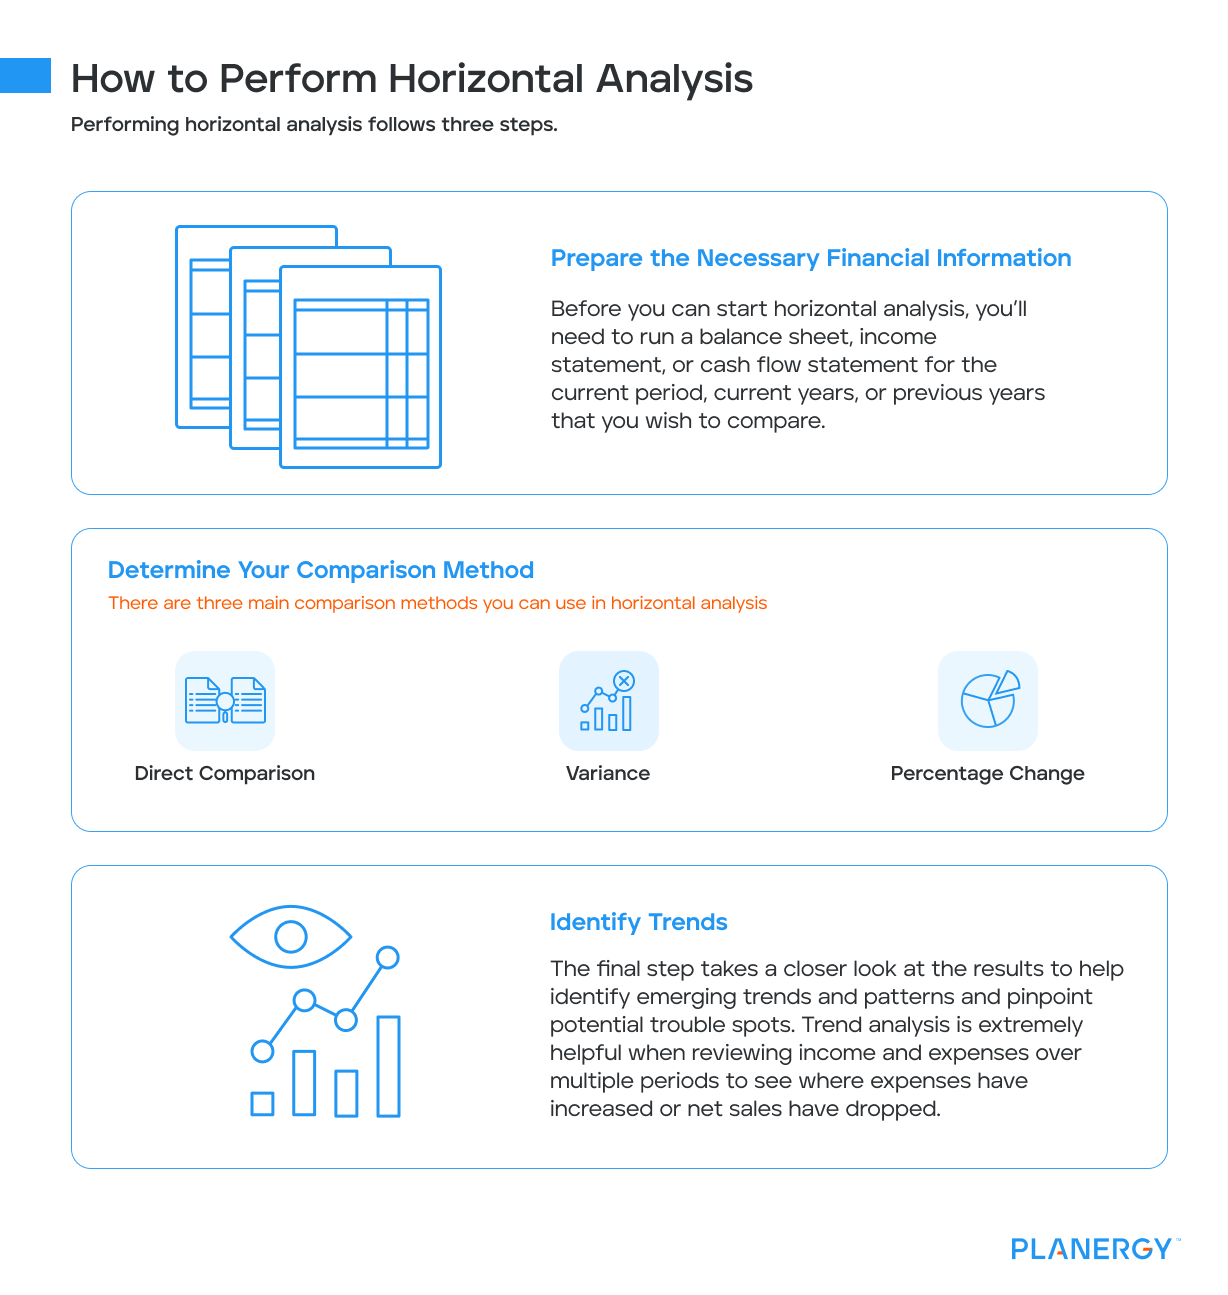
Prepare the Necessary Financial Information
Before you can start horizontal analysis, you’ll need to run a balance sheet, income statement, or cash flow statement for the current period, current years, or previous years that you wish to compare.
This can be monthly, quarterly, or annually, but the statements you compare must be for the same length of time.
For example, you don’t want to compare totals from a quarterly income statement against an annual income statement.
Determine Your Comparison Method
There are three main comparison methods you can use in horizontal analysis.
Direct Comparison – The direct comparison method compares the results of one accounting period to another.
For example, if you’re using your balance sheet, you could compare total assets from one period against total assets from another period to determine the level of change between the two periods.
Variance – Variance analysis looks at the level of change that took place between the two accounting periods.
The variance method allows you to view exactly how much has changed and can help spot trends.
Percentage Change – The percentage change method is another form of the variance method but instead of a number total, you can view the variance by percentage.
This is done by subtracting the amount in the base year from the amount in the comparison year and then dividing it by the base year amount.
Identify Trends
The final step takes a closer look at the results to help identify emerging trends and patterns and pinpoint potential trouble spots.
Trend analysis is extremely helpful when reviewing income and expenses over multiple periods to see where expenses have increased or net sales have dropped.
Examples of Horizontal Analysis
Let’s say your company wants to compare revenue for two years. You can choose to use any or all of the methods described above to do so.
Your revenue for 2023, which is the base year was $525,000, and revenue for 2024, which is the comparison year, was $675,000.
You can choose to compare the two totals to see that your 2023 revenue is more than 2024 revenue, subtract the base year total from the comparison year total to view the amount of the variance or you can calculate the percentage increase.
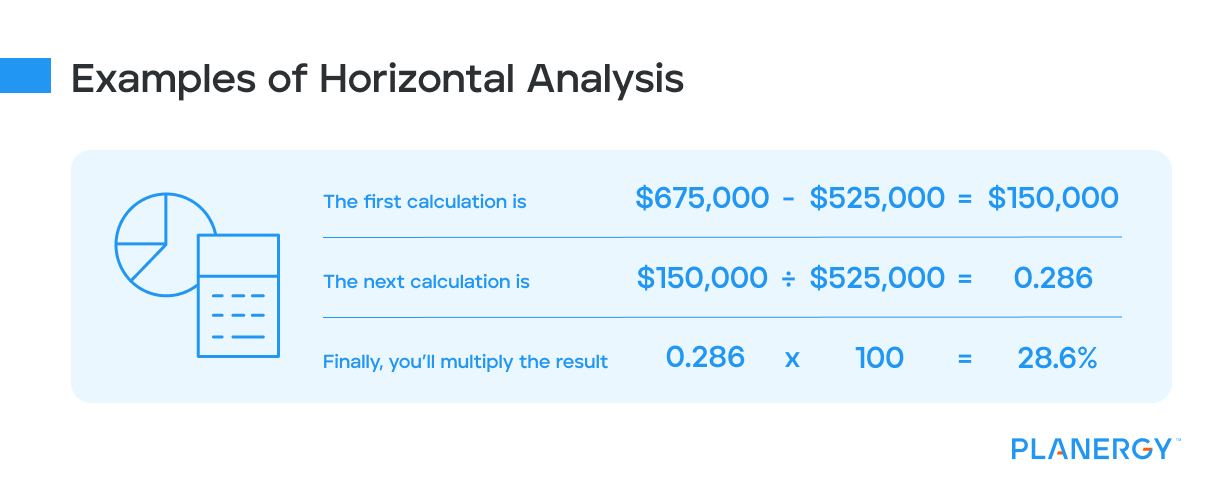
The first calculation is $675,000 – $525,000 = $150,000, which is how much your revenue increased in 2024.
Next, you’ll divide the result by the base year total: $150,000 / $525,000 = .286.
Finally, you’ll multiply the result x 100: .286 x 100 = 28.6% increase in revenue. These metrics allow you to see the level of change from period to period.
What is Vertical Analysis?
Vertical analysis provides a different look at your financial statements, with each line item on your financial statement listed as a percentage of the established base figure.
While this may sound confusing, it’s simply another way of looking at company performance.
For example, when using vertical analysis with your income statement, you would use your gross sales number (never net sales) as the base number, with all other line-item totals as a percentage of the base number.
Unlike horizontal analysis, which is designed to be used for multiple reporting periods, many companies use vertical analysis to assess a single period.
How to Perform Vertical Analysis
You can perform vertical analysis by following these steps:
Prepare Your Balance Sheet
Before you can complete vertical analysis, you’ll have to prepare a balance sheet, either by running one or by preparing one manually.
The balance sheet must be in balance using the accounting equation: Assets = Liabilities + Equity.Calculate Percentages for Each Line Item Account
This is done by dividing your line item total by your base number, which will be total assets, total liabilities, or total equity, depending on the section(s) you’re performing vertical analysis. The result of that calculation is then multiplied by 100 to obtain the percentage.
Analyze the Results
Once you’ve completed your calculations, analyzing the results of those calculations is important.
While it’s helpful to complete vertical analysis over several accounting periods to analyze results, vertical analysis is especially useful if you’re interested in comparing your business results to those of similar businesses.
Examples of Vertical Analysis
Vertical analysis only requires the use of a single accounting period and includes both the dollar amount and the percentage for each line item.
The following is an example of vertical analysis completed for the asset section of your balance sheet.
Vertical analysis can also be completed for the liability and equity sections of your balance sheet as well.
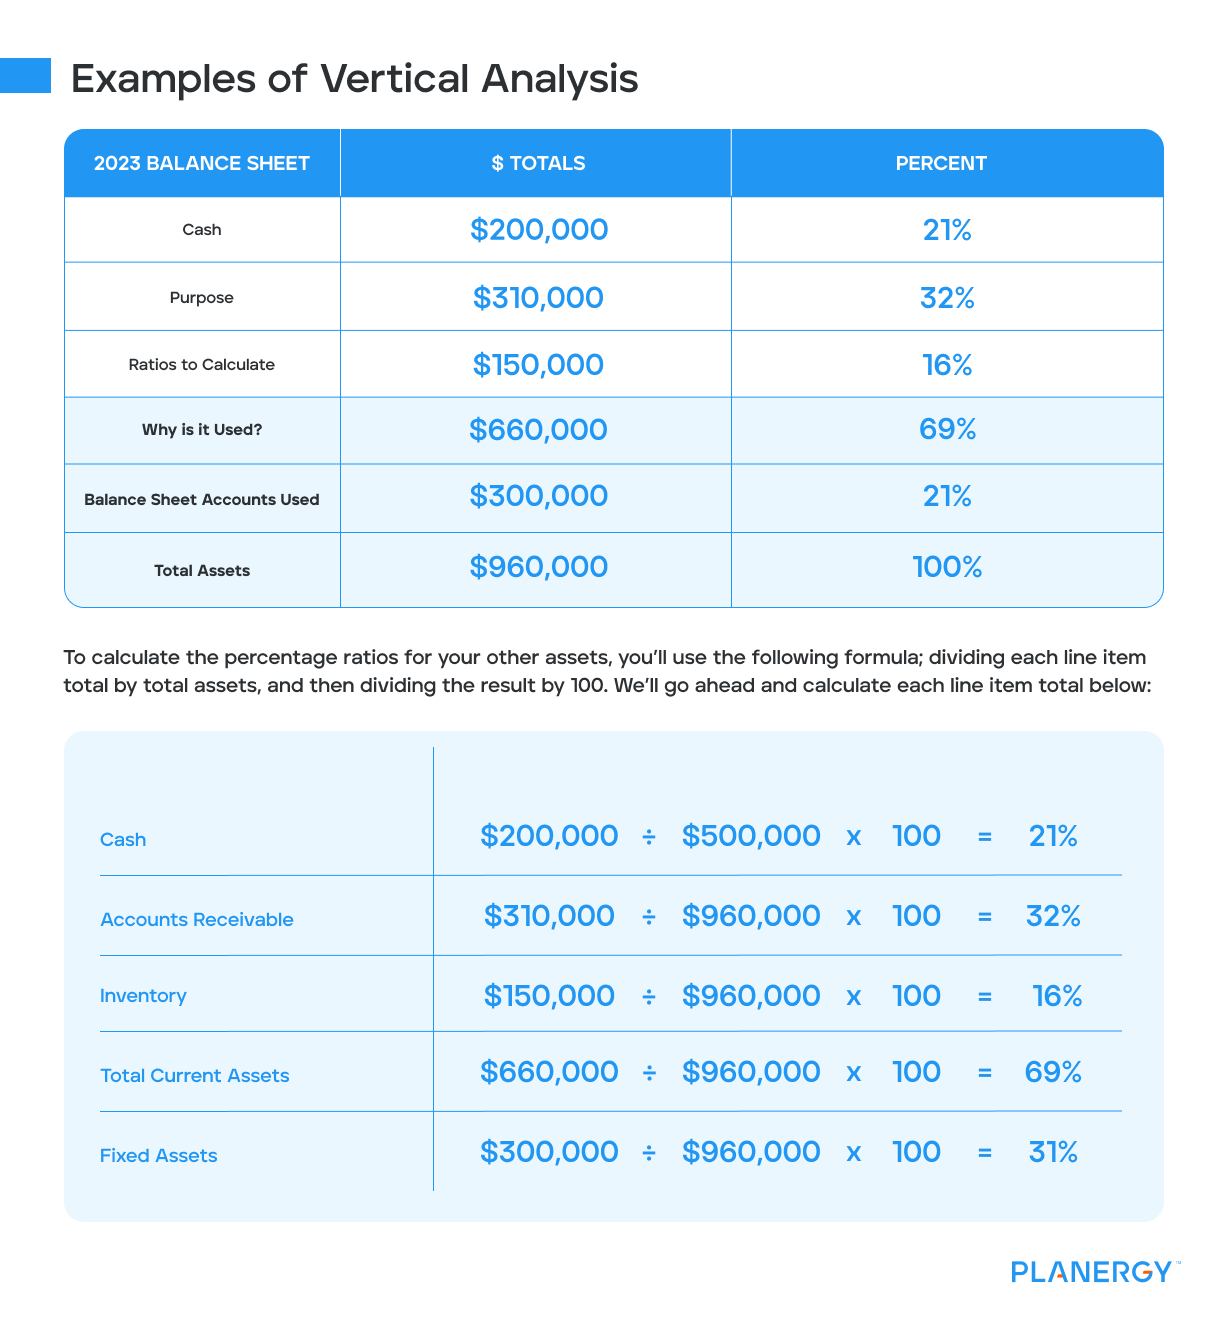
| 2023 Balance Sheet | $ Totals | Percent |
|---|---|---|
| Cash | $200,000 | 21% |
| Accounts Receivable | $310,000 | 32% |
| Inventory | $150,000 | 16% |
| Total Current Assets | $660,000 | 69% |
| Fixed Assets | $300,000 | 31% |
| Total Assets | $960,000 | 100% |
Your total assets are considered your base amount and are 100%. To calculate the percentage ratios for your other assets, you’ll use the following formula; dividing each line item total by total assets, and then dividing the result by 100. We’ll go ahead and calculate each line item total below:
$200,000 / $500,000 x 100 = 21%
$310,000 / $960,000 x 100 = 32%
$150,000 / $960,000 x 100 = 16%
$660,000 / $960,000 x 100 = 69%
$300,000 / $960,000 x 100 = 31%
Your total current assets and your total fixed assets should always equal your total assets, both numerically and in percentages.
It’s possible to complete your vertical analysis using only one accounting period, but you can also use it to compare results with another year, as shown below.
| 2023/2024 Balance Sheet | 2023 Totals | 2022 Totals | Difference | Percent |
|---|---|---|---|---|
| Cash | $1,000,000 | $950,000 | $50,000 | 5.3% |
| Accounts Receivable | $2,000,000 | $2,250,000 | ($250,000) | (11.1%) |
| Inventory | $750,000 | $600,000 | $150,000 | 25% |
| Total Current Assets | $3,750,000 | $3,800,000 | ($50,000) | 1.3% |
| Fixed Assets | $1,250,000 | $1,050,000 | $200,000 | 19% |
| Total Assets | $5,000,000 | $4,850,000 | $150,000 | 3.1% |
While this method requires additional work, it provides a greater level of detail than the simple percentage method used in the first example.
What is the Difference Between Horizontal and Vertical Analysis?
The single biggest difference between horizontal and vertical analysis is the focus.
Horizontal analysis looks at financial statements that can span multiple periods or even multiple years, while vertical analysis usually concentrates on a single accounting period.
Horizontal analysis is especially important for well-established businesses that want to view performance over a period of time. For example, horizontal analysis allows you to easily spot trends, and view financial performance over a selected time frame.
On the other hand, vertical analysis provides a close-up of financial statement results and the relationship to a specific benchmark.
For example, vertical analysis lets you see exactly how much of your gross profit is going towards the cost of goods sold, or if your overhead costs eat up a significant amount of your revenue.
What is the Difference Between a Horizontal and a Vertical Balance Sheet Format?
The difference is pretty self-explanatory. A horizontal balance sheet displays financial information as follows, emphasizing the accounting equation, which is total assets = total liabilities + total equity.
| Assets | Liabilities & Equity |
|---|---|
| Cash: $50,000 | Accounts Payable: $19,000 |
| Accounts Receivable: $37,000 | Total Liabilities: $19,000 |
| Total Assets: $87,000 | Retained Earnings: $68,000 |
| Total Equity: $68,000 | |
| Total Assets: $87,000 | Total Liabilities & Equity: $87,000 |
A vertical balance sheet displays all balance sheet accounts vertically.
| Assets | |
|---|---|
| Cash | $50,000 |
| Accounts Receivable | $37,000 |
| Total Assets | $87,000 |
| Liabilities & Equity | |
|---|---|
| Accounts Payable | $19,000 |
| Total Liabilities | $19,000 |
| Retained Earnings | $68,000 |
| Total Equity | $68,000 |
| Total Liabilities & Equity | $87,000 |
A vertical balance sheet format makes it much easier to compare balance sheet totals between multiple periods or just easily assess financial performance for a single month.
When performing horizontal or vertical analysis, you would be adding additional columns to those displayed above that will reflect changes or trends.
What Are the Benefits of Horizontal and Vertical Analysis?
There are many benefits to using both horizontal and vertical analysis for your business.
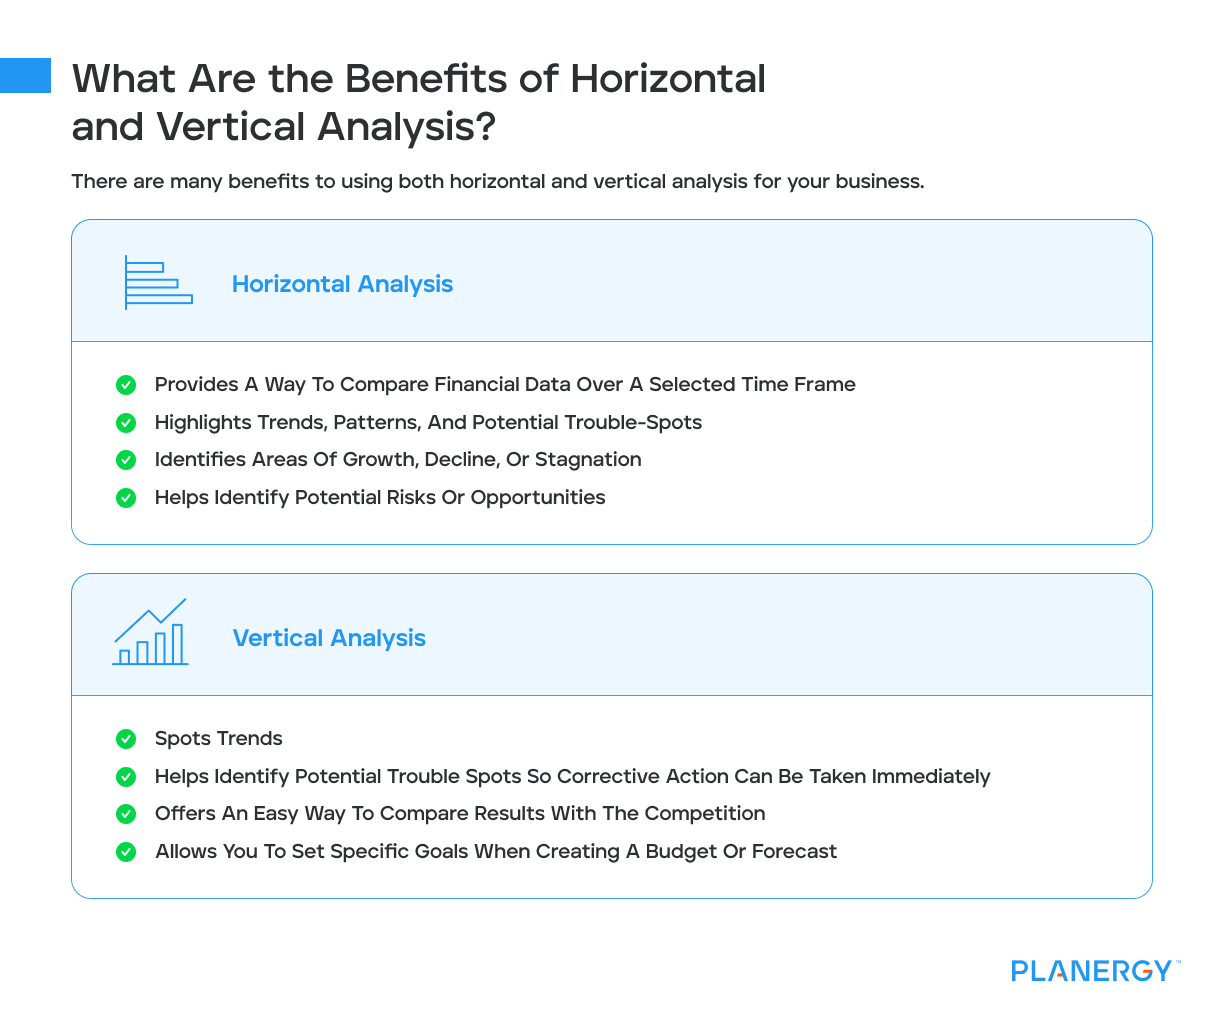
Horizontal Analysis
Provides a way to compare financial data over a selected time frame
Highlights trends, patterns, and potential trouble-spots
Identifies areas of growth, decline, or stagnation
Helps identify potential risks or opportunities
Vertical Analysis
Spots trends
Helps identify potential trouble spots so corrective action can be taken immediately
Offers an easy way to compare results with the competition
Allows you to set specific goals when creating a budget or forecast
Though each has its advantages, when used together, horizontal and vertical analysis offers a comprehensive picture of a company’s financial health by spotting trends and patterns that have occurred over a specific period.
Why Financial Analysis is Important for Your Business
Performing horizontal and vertical analysis is one of the best ways to obtain a clear picture of your company’s financial health.
Performing this analysis regularly not only gives you a complete view of your current finances but also provides a look a potential trouble spots by pinpointing troubling trends or fluctuations.
But horizontal and vertical analysis can also identify well-performing areas and growth patterns while providing businesses with a good peak into their company’s financial performance well into the future, leading to more informed decision-making and a more profitable future.


")
