What's Planergy?

Modern Spend Management and Accounts Payable software.

Helping organizations spend smarter and more efficiently by automating purchasing and invoice processing.

We saved more than $1 million on our spend in the first year and just recently identified an opportunity to save about $10,000 every month on recurring expenses with Planergy.

King Ocean Logo

Cristian Maradiaga

King Ocean

Download a free copy of "Indirect Spend Guide", to learn:

  • Where the best opportunities for savings are in indirect spend.
  • How to gain visibility and control of your indirect spend.
  • How to report and analyze indirect spend to identify savings opportunities.
  • How strategic sourcing, cost management, and cost avoidance strategies can be applied to indirect spend.

Financial Analysis Data: The Importance of Data Accuracy

Financial Analysis Data

Financial analysis uses collected data to better assess your company’s financial performance.

Used for decision-making, financial analysis allows you to evaluate financial trends within your business, develop long-term strategic plans, and set internal financial policies.

For accurate results and actionable insights, you must have access to accurate data.

What Is Financial Analysis?

Financial analysis involves the examination of financial statements and other financial data to determine the financial health and financial performance of a business.

While most companies perform some level of financial statement analysis, analyzing additional financial data helps to prepare a more complete picture of your business.

Why Is Financial Analysis Important?

Financial analysis allows you to identify trends in your business. For instance, if sales are up every spring, but drop in the fall, having access to that data allows you to plan better for those slow months.

Financial analytics also allows business owners, CFOs, and accounting professionals to identify potential risks and better allocate resources more effectively.

What Are the Challenges in Financial Analysis?

Though a necessary component for your business, financial analysis comes with its own set of challenges.

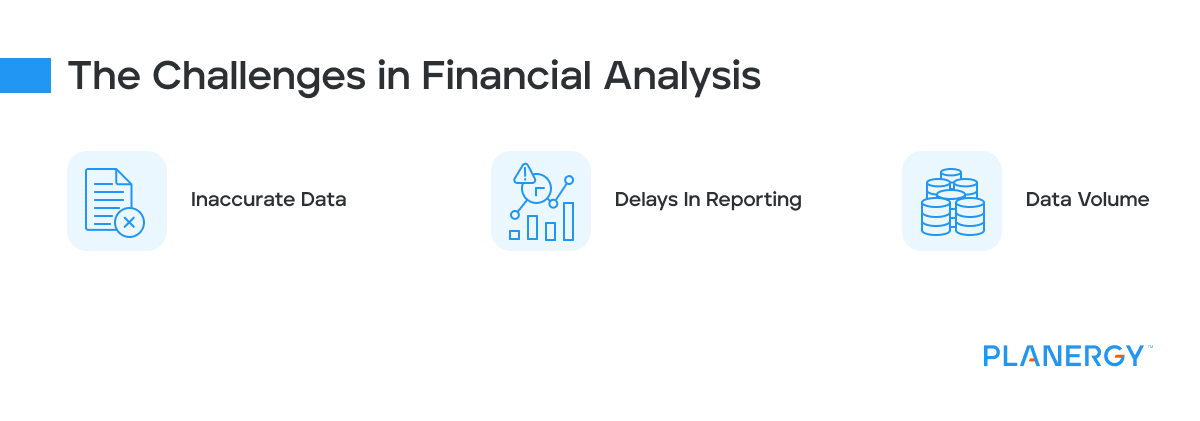
  • Inaccurate Data

    Financial analysis is essential, but for it to be useful, it’s essential that the data analyzed be accurate. It’s useless to analyze a financial statement if the numbers on the statement are not a true representation of the business.

  • Delays in Reporting

    Reporting delays can wreak havoc on data, leaving you with understated or overstated totals. Switching to an automated accounting application provides you with real-time reports so that every transaction is reflected in your financial statement totals.

  • Data Volume

    While smaller businesses will not need to be concerned about this, analyzing data for a Fortune 500 company is time-consuming based on the volume of data that needs to be analyzed.

    When working with considerable amounts of data, big data analytics adds new data challenges but also opportunities. But using the data correctly will ensure good data and good insights from all of that data.

Challenges in financial analysis

Why Data Accuracy Is Important for Financial Analysis?

Accurate data reflects the financial reality of your business, and if the data being analyzed is not accurate, the resulting decisions made based on that data will be inaccurate as well.

Many working parts are needed for data to be accurate.

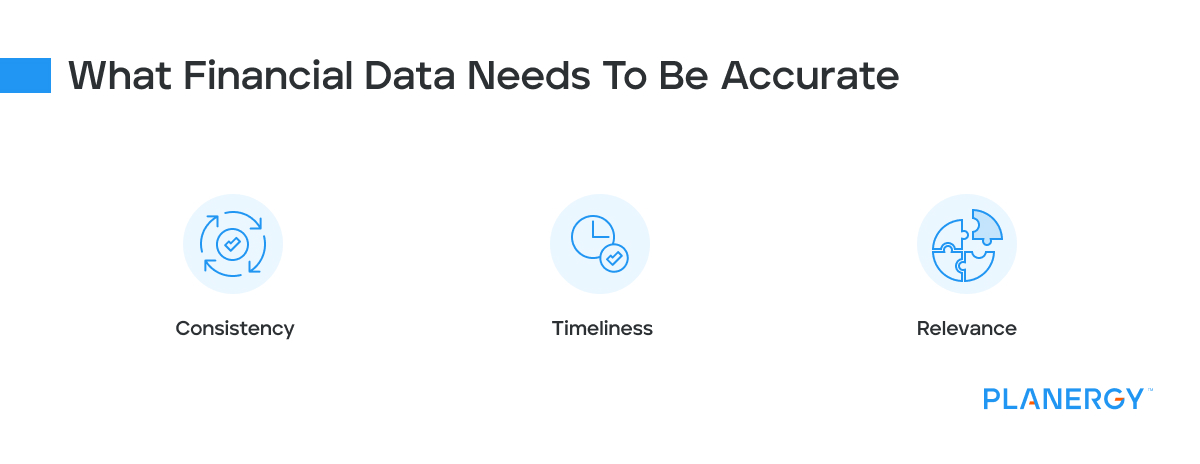
    • Consistency

      Consistency means that all data collected has been similarly formatted across multiple data sets.

    • Timeliness

      Timeliness is essential for accurate data. When data is received late or is delayed, the result is usually inaccuracy.

    • Relevance

      Make sure that the data your company collects is relevant. Even if data is accurate, if it’s not relevant to a particular type of analysis, it’s unnecessary.

    • Completeness

      Data has to be complete for it to be analyzed properly.

      For example, if you regularly collect data from five company locations and receive data for only four of those locations, the resulting data will be inaccurate, even if those four locations are accurate.

    What financial data needs to be accurate

If any one of these components is missing, your financial position will not be accurate, which can negatively impact several areas, including forecasting accuracy, brand credibility, productivity, and even customer engagement.

But most important, inaccurate data leads to poor business decisions that can negatively impact your bottom line.

What Are the Reasons for Data Inaccuracy in Finance?

There are many reasons why data inaccuracy occurs. Those reasons include:

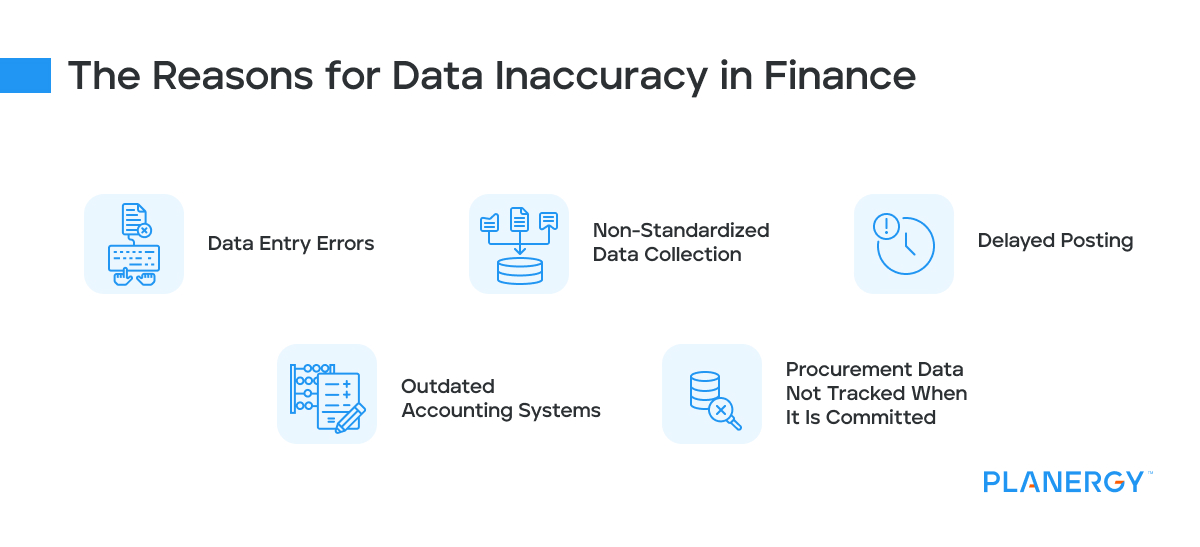
    • Data Entry Errors

      Data entry errors are one of the top reasons why data is inaccurate. A single typo can throw financial statements off by thousands of dollars, with the ripple effect impacting decision-making at its highest level.

    • Non-standardized Data Collection

      Assuming that your accounting staff will know the correct way to enter data can lead to major issues with accuracy.

      This can be a major issue if you’re using multiple software applications in your business, since one application may record data using a different format.
    • Delayed Posting

      If you’re waiting for accounts payable invoices to be approved before entering them into your accounting software application, your AP totals will be understated, while your net profit will be overstated.

    • Outdated Accounting Systems

      If you’re still using inefficient manual processes such as Excel spreadsheets to account for your data, or utilize multiple systems to record transactions, the data produced will not be a true reflection of your business’s financial health.

    • Procurement Data Not Tracked When It Is Committed

      If you are not managing spend systematically you are not getting timely data for accruals and committed spend visibility.

      You won’t know you have invoices due until you receive them. This leaves a significant gap in your data for financial analysis.

    Reasons for data inaccuracy in finance

The bottom line is that until you have internal processes in place to ensure data accuracy, it’s likely that data analysis will continue to pose issues.

Common Methods of Financial Data Analysis

Numerous methods can be used when analyzing financial data.

But regardless of the financial data analysis method used, they all utilize at least one of these three financial statements; a balance sheet, income statement, or cash flow statement to complete any analysis.

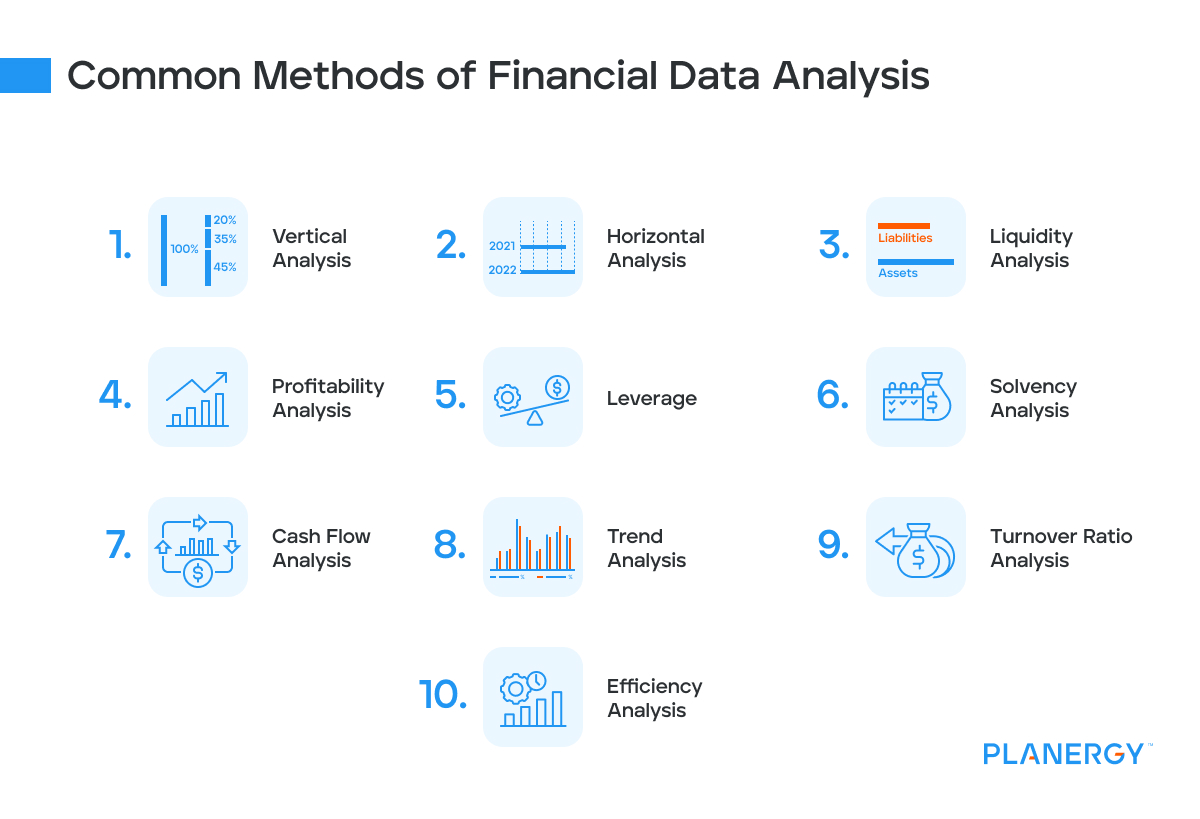
There are the top ten methods commonly used to analyze financial data.

  1. Vertical Analysis

    Uses financial statements to compare totals against a base percentage.

  2. Horizontal Analysis

    Horizontal analysis, sometimes also know as trend analysis, uses financial statements from multiple accounting periods to spot changes in revenue, expenses, and income.

  3. Liquidity Analysis

    Measure the ability of your company to meet its short-term financial obligations.

  4. Profitability Analysis

    Measures the ability to generate profits from regular company operations.

  5. Leverage Analysis

    Measures how much debt your business currently is using to finance day-to-day operations.

  6. Solvency Analysis

    Measures total debt against total assets to determine your company’s ability to meet long-term financial obligations.

  7. Cash Flow Analysis

    Looks at cash inflows and outflows as well as the levels of cash available in your business at a specific time.

  8. Trend Analysis

    Trend analysis looks at company performance over multiple accounting periods to identify both trends and patterns.

  9. Turnover Ratio Analysis

    Measures how effectively your company is using assets to generate income.

  10. Efficiency Analysis

    Measures how efficiently a company uses all of its resources to generate income.

Common methods of financial data analysis

What Is Financial Statement Analysis?

Financial statement analysis examines financial statements to determine the health of the business. Depending on the information that you wish to obtain, you can analyze any or all of your financial statements.

There are three methods used to analyze financial statements: vertical analysis, horizontal analysis, and ratio analysis.

  • Vertical Analysis

    Vertical analysis looks at a single column of numbers and how they relate to another set of numbers in the same report.

    Vertical analysis is commonly used when analyzing an income statement, with each line item displaying a total and a percentage of sales or revenue. For example, each line item on your income statement will be listed as a percentage of sales.

  • Horizontal Analysis

    Horizontal Analysis uses data from previous accounting periods to compare against. Also known as trend analysis, horizontal analysis helps identify changes over a specific period of time.

    For example, if you run a balance sheet for December 2022, you would also run a balance sheet for December 2021 to view trends.

  • Ratio Analysis

    Ratio analysis uses the data contained in financial statements to calculate a series of financial ratios, with the results properly analyzed.

    Though hundreds of accounting ratios can be calculated and analyzed, the following are the most common ones.

    • Activity Ratios

      Activity ratios, such as the accounts payable turnover ratio, help you assess how well your resources are being used.

    • Leverage Ratios

      Leverage ratios, also known as solvency ratios, offer a look at debt levels and how dependent a company is on debt to finance day-to-day operations.

    • Liquidity Ratios

      Liquidity ratios, like the current ratio, and the quick ratio help a business determine how liquid a business is, an important factor in determining the ability of the business to remain operational.

    • Profitability Ratios

      Profitability ratios look at profit levels, examining return on assets and return on equity, as well as the break-even point of a business.

Whatever method you use to analyze your financial statements, the resulting metrics will help you understand how well your company is performing financially, as well as identify potential trouble spots.

How Do You Analyze a Financial Statement?

Not all methods listed above work with all financial statements.

For example, vertical analysis is typically used with an income statement or profit and loss statement, dividing each line item by total sales to determine the percentage of each line item.

For example, if you have $1,000,000 in sales, with a cost of goods sold of $380,000 and a gross profit of $620,000, you would divide both into your total sales to get the percentage.

Total Sales$1,000,000100%
Cost of Goods Sold$380,00038%
Gross Profit$620,00062%

You would also take your expenses and divide that by total sales to come up with the correct percentage.

Though most commonly used with an income statement, vertical analysis can also be used with a balance sheet if desired.

For horizontal analysis, there are three options that you can use:

  • Direct Comparison

    Direct comparison uses historical data to compare the totals of one accounting period to another period.

  • Variance

    Commonly used by investors to determine the financial health of a business, the variance method calculates the variance between two accounting periods. The variance method is also useful for spotting trends.

  • Percentage

    The percentage method, like the variance method, helps spot trends b by applying a percentage to each accounting period.

 20212022$ Change% Change
Revenue$675,000$680,000$5,0007.4%
Cost of Goods Sold$200,000$275,000$75,00037.5%
Gross Profit$475,000$405,000-$70,000-16%

To calculate the $ change amount, you’ll subtract the 2021 totals from the 2022 totals.

To calculate the % change, you’ll need to divide the amount in the $ change column by the 2021 total.

For example, to determine the revenue percentage change, you’ll divide $5,000 by $675,000 which equals 7.4%.

You can compare as many accounting periods as you like, which gives you the ability to spot trends such as increases or decreases in revenue, cost of goods sold, or other expenses.

How Do You Analyze Cash Flow?

Cash flow analysis looks at cash inflows and outflows for a particular accounting period. Cash flow analysis always looks at three areas:

  1. Cash flow from operations
  2. Cash flow from investing
  3. Cash flow from financing

The cash flow statements provide details on how a company spends money, how money is received, and how it impacts available working capital.

To properly analyze cash flow statements, you’ll need to examine all of the areas that directly impact cash flow including accounts payable, inventory, credit, accounts receivable, and investments.

There are two common methods used to analyze cash flow; the direct method, which subtracts cash disbursements from cash received, and the indirect method, which starts with your net income total and adds or subtracts various revenue and expenses.

How Does Real-Time Data Improve Financial Analysis?

Having access to real-time data is a necessity for proper data analytics.

For example, if you’re using a manual system to process accounts payable, your financial data will not include current invoices, which are waiting to be approved or entered into your accounting software application.

By not including those invoices that are waiting to be approved or entered, your accounts payable balance will be artificially low.

And when your AP balance is artificially low, your net income will be artificially high, since it doesn’t include the complete balance of what you currently owe your vendors.

These inaccuracies will also impact your cash flow statement since your accounts payable balance directly impacts your cash flow totals.

When you use an automated accounting application, you’ll have access to real-time data, which in turn means that any financial statements printed, ratios calculated, or analysis completed will be completely accurate.

How Can You Improve the Accuracy of Financial Analysis?

Improving the accuracy of your financial analysis always starts with accurate financial reporting.

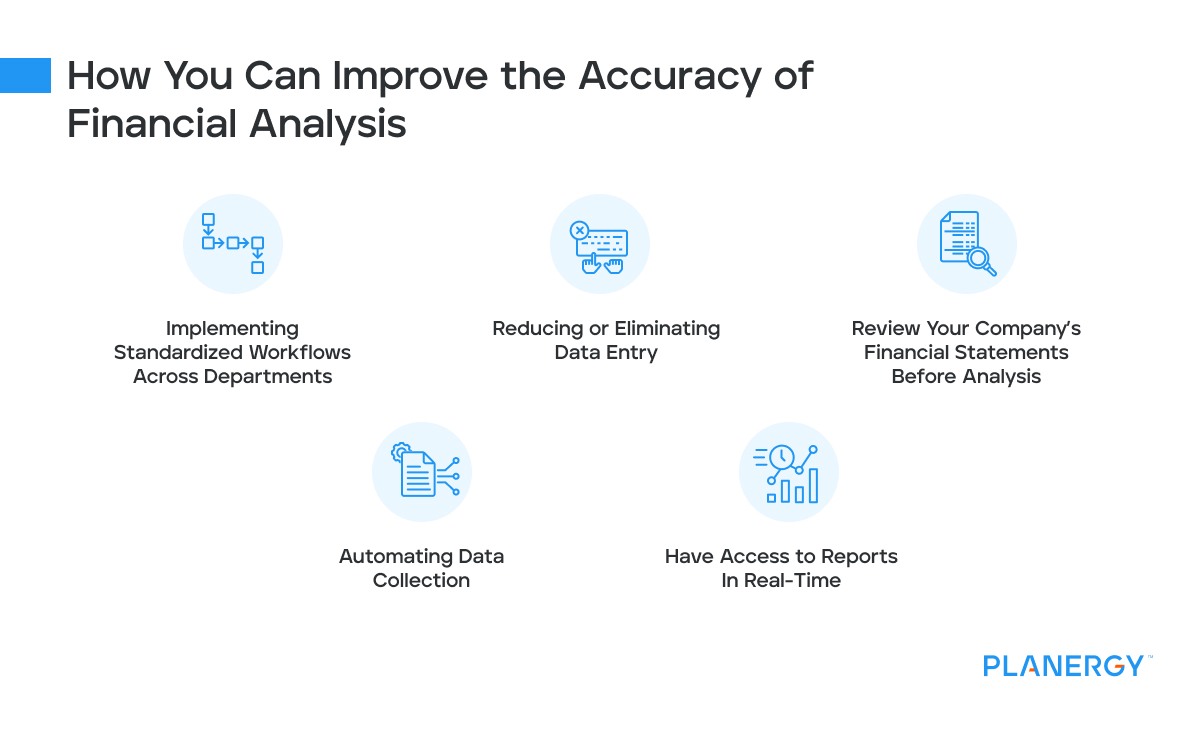
There are several things that you can do to improve financial statement accuracy. These include:

  • Implementing standardized workflows across departments

    If you’re pulling data from multiple departments, be sure that there are standardized practices and deadlines in place to ensure data accuracy.

  • Reducing or Eliminating Data Entry

    Data inaccuracy is commonly the result of data entry errors. Just one or two errors can throw off financial statement balances significantly.

  • Review Your Company’s Financial Statements Before Analysis

    Sometimes even a glance at a balance sheet or income statement can identify inaccurate data. Before you spend a lot of time analyzing data that ultimately ends up being wrong, quickly checking your statements can save you a lot of time.

  • Automating Data Collection

    Using an integrated, automated accounting software application can eliminate the need to pull data from various sources and then compile it in a separate spreadsheet. The more you can automate data retrieval, the more likely your collected data will be accurate.

  • Have Access to Reports in Real-Time

    Business intelligence and real-time reporting are key to financial statement accuracy. Being able to run reports in real-time means that you can safely assume that all relevant data is included in your reports.

How you can improve the accuracy of financial analysis

Accuracy is Necessary for Financial Analysis

Corporate finance relies on data accuracy. Missing or inaccurate financial information leaves your business vulnerable to significant monetary losses, threatens operational efficiency, and can even threaten the viability of your business.

Switching to an automated procure-to-pay software that incorporates AP Automation software, like Planergy, with spend analytics and powerful drill down accounts payable reporting will help get a clearer picture of spend commitments.

Automating processes in procurement and AP by using a combination of artificial intelligence, machine learning, and robotic process automation helps to eliminate data errors and other pitfalls.

This allows you, and interested stakeholders, to trust the data and make more informed decisions about your business.

What’s your goal today?

1. Use Planergy to manage purchasing and accounts payable

We’ve helped save billions of dollars for our clients through better spend management, process automation in purchasing and finance, and reducing financial risks. To discover how we can help grow your business:

2. Download our “Indirect Spend Guide”

Download a free copy of our guide to better manage and make savings on your indirect spend. You’ll also be subscribed to our email newsletter and notified about new articles or if have something interesting to share.

3. Learn best practices for purchasing, finance, and more

Browse hundreds of articles, containing an amazing number of useful tools, techniques, and best practices. Many readers tell us they would have paid consultants for the advice in these articles.

Business is Our Business

Stay up-to-date with news sent straight to your inbox

Sign up with your email to receive updates from our blog

This website uses cookies

We use cookies to personalise content and ads, to provide social media features and to analyse our traffic. We also share information about your use of our site with our social media, advertising and analytics partners who may combine it with other information that you’ve provided to them or that they’ve collected from your use of their services.

Read our privacy statement here.